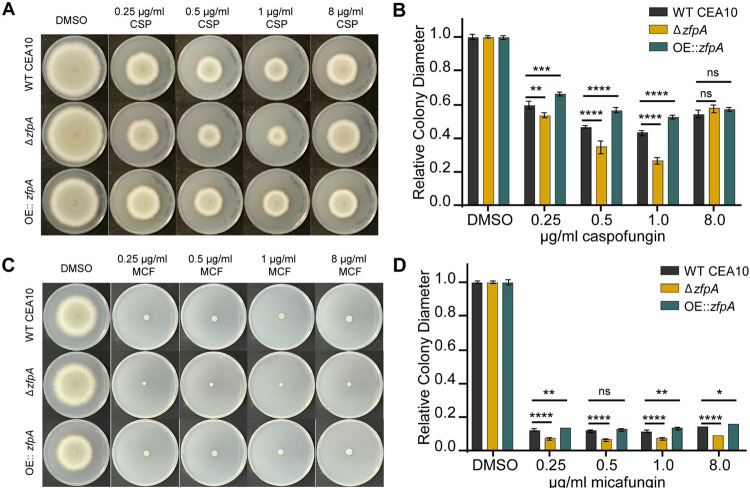
Fig 6. ZfpA mediates echinocandin tolerance.
(A) Susceptibility of WT CEA10, ΔzfpA, and OE::zfpA to 0.25, 0.5, 1, and 8 μg/mL caspofungin (CSP). 104 spores were point-inoculated on solid GMM with caspofungin or DMSO. Images of caspofungin plates are representative of colony growth 5 days post inoculation. (B) Bars represent mean±s.d. of colony diameter at 4 days post inoculation of 4 plates per condition. (C) Susceptibility of WT CEA10, ΔzfpA, and OE::zfpA to 0.25, 0.5, 1, and 8 μg/mL micafungin (MCF). 104 spores were point-inoculated on solid GMM with micafungin or DMSO. Images of micafungin plates are representative of colony growth 4 days post inoculation. (D) Bars represent mean±s.d. of colony diameter at 4 days post inoculation of 4 plates per condition. p values calculated by ANOVA with Tukey’s multiple comparisons. *p<0.05. **p<0.01,***p<0.001, ****p<0.0001.

