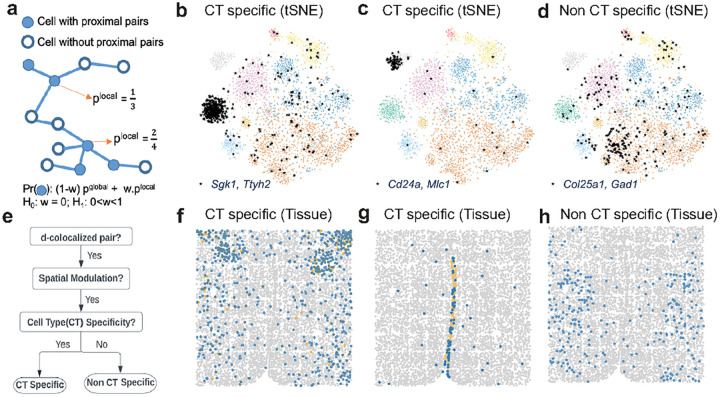
Figure 5. Spatial modulation of d-colocalized pairs in mouse hypothalamus preoptic region.
(a) Probabilistic graphical model to detect spatially modulated gene pair. In a graph where nodes represent cells and edges represent spatial proximity, each cell is first flagged based on whether the gene pair is significant by PP test in that cell. The likelihood function is a product over all cells of a weighted sum of plocal, the local density of flagged cells in cell’s neighborhood, and pglobal, free parameter. The weight w is also a free parameter. A likelihood ratio score is computed to compare this model to a null model where the local (spatial) information is not used, (b) t-SNE plot of a spatially modulated d-colocalized gene pair Sgk1-Ttyh2 showing that it is a proximal pair (black stars) significantly more often in Mature Oligodendrocytes (OD) and is significant in other cell types. (See Figure 4a for cell type annotations.) (f) Cells in spatial coordinates, shown in blue if the gene pair of (b) Sgk1-Ttyh2 is a proximal pair, in orange if the cell is Mature OD but Sgk1-Ttyh2 is not a proximal pair, and in grey otherwise. (c,g) t-SNE plot (c) and spatial plot (g) showing a spatially modulated d-colocalized gene pair Cd24a-Mlc1 significant specifically in cells of one cell type (ependymal cells) and not significant in other cell types. (d,h) t-SNE plot (d) and spatial plot (h) of a gene pair Col25a1-Gad1 that is a proximal pair across several cell types, (e) Flowchart showing how a spatially modulated d-colocalized pair is categorized based on its cell type specificity.

