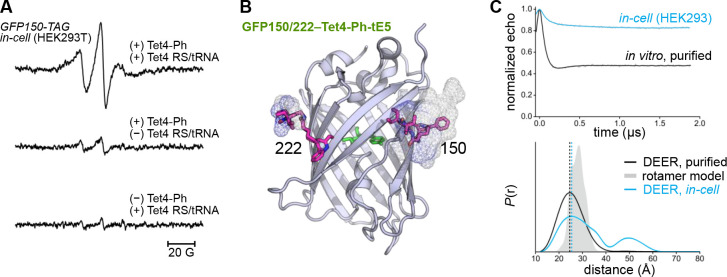
Figure 4. CW EPR and DEER in HEK293 cells.
(A) Room temperature X-band EPR spectra of HEK293T cells transfected with GFP150-TAG and Tet4 Mb-PylRS/tRNA in the presence of 150 μM Tet4-Ph ncAA (top). Cells were spin-labeled with 200 nM sTCO-tE5 (10 min, r.t.) and spectra were recorded 1 h post-labeling. EPR spectra of labeled cells lacking either the Mb-PylRS/tRNA pair (middle) or Tet4-Ph ncAA (bottom) are displayed on identical scales. (B) Structural model of GFP150/222–Tet4-Ph labeled with sTCO-tE5 displaying estimated rotameric distributions as mesh surface. Spin-labeled side chains were modeled with the chiLife package in Python. (C) 4-pulse DEER time traces (top) and distance distributions (bottom) for GFP150/222–Tet4-Ph-tE5 recorded from in vitro-purified protein (black) and in intact HEK293T cells (blue). Error bands on the distributions estimated from LongDistances are shown but are similar to the linewidth. The simulated distance distribution from rotameric modeling is shown in gray shade.

