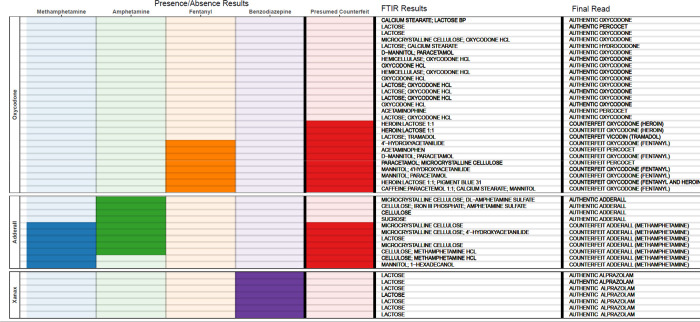
Figure 2. Drug Checking Results From n=45 Pill Samples Obtained in Northern Mexico.
Pill-level data are shown, with one row per sample analyzed. The labs on the far left show the prompt used to obtain each pill, i.e. what the sample was sold as. Binary, presence/absence results are shown for four drug categories using shaded vs unshaded boxes. FTIR results are shown in free text, with up to 3 results separated by semi-colons. The ‘final read’ as determined by the investigators is shown in free text. Not all final reads are 100% definitive, rather it represents the most likely result as determined by all forms of drug checking and ethnographic data (see the supplement for a more elaborate description).

