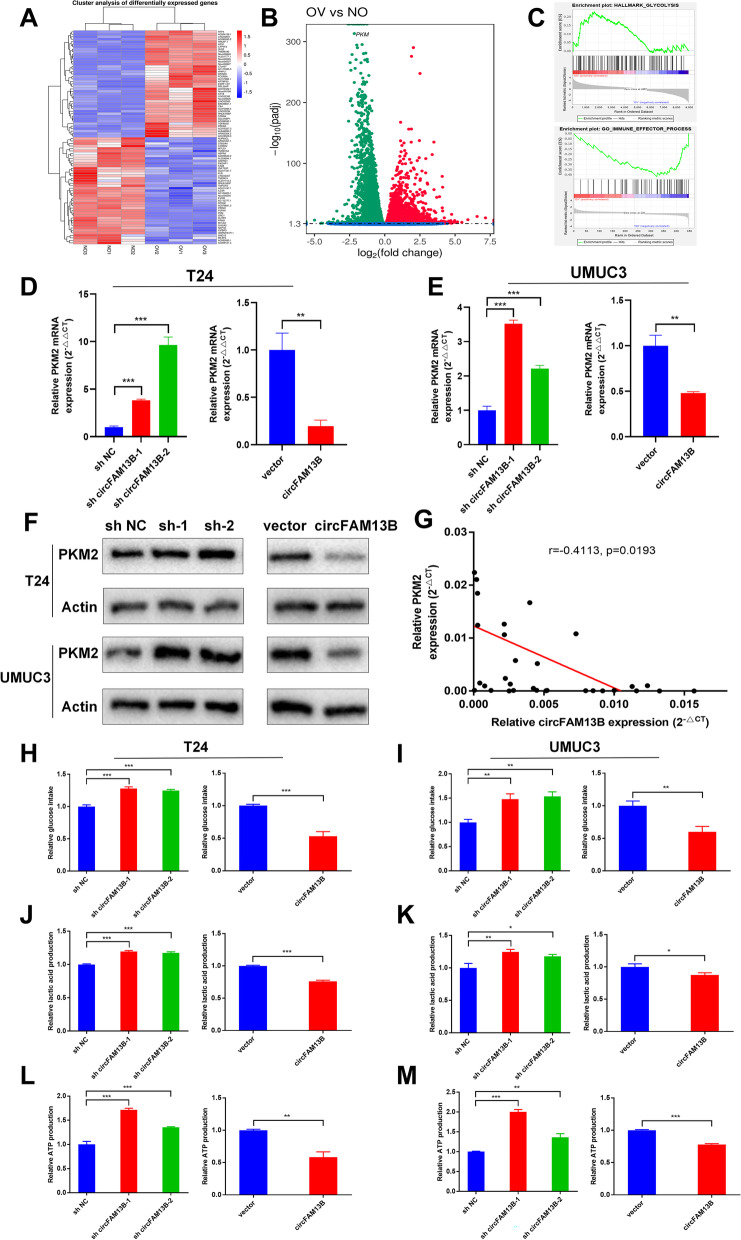
Fig. 3.
CircFAM13B inhibited the glycolysis of BCa cells by attenuating PKM2 expression. A Heat map of mRNA sequencing in three pairs of circFAM13B overexpression and relative control T24 cells. B Volcano plot of mRNA sequencing that indicates the differentially expressed genes, including PKM2. C GSEA analysis showed that differentially expressed genes were enriched in the glycolysis and immune response pathway. D-E QRT-PCR results indicated that circFAM13B inhibited the mRNA level of PKM2 in T24 and UMUC3 cells (**P < 0.01, ***P < 0.001, Student’s t-test). F Western blot results confirmed that circFAM13B inhibited the protein level of PKM2 in T24 and UMUC3 cells. G. Pearson’s correlation analysis was conducted to validate the correlation of circFAM13B and PKM2. H-I Glucose detection assays indicated that circFAM13B inhibited the glucose intake of T24 and UMUC3 cells (**P < 0.01, ***P < 0.001, Student’s t-test). J-K Lactic acid detection assays confirmed that circFAM13B inhibited the lactic acid production of T24 and UMUC3 cells (*P < 0.05, **P < 0.01, ***P < 0.001, Student’s t-test). L-M ATP detection assays indicated that circFAM13B inhibited the ATP production of T24 and UMUC3 cells (**P < 0.01, ***P < 0.001, Student’s t-test). Data are expressed as mean ± SD, n = 3

