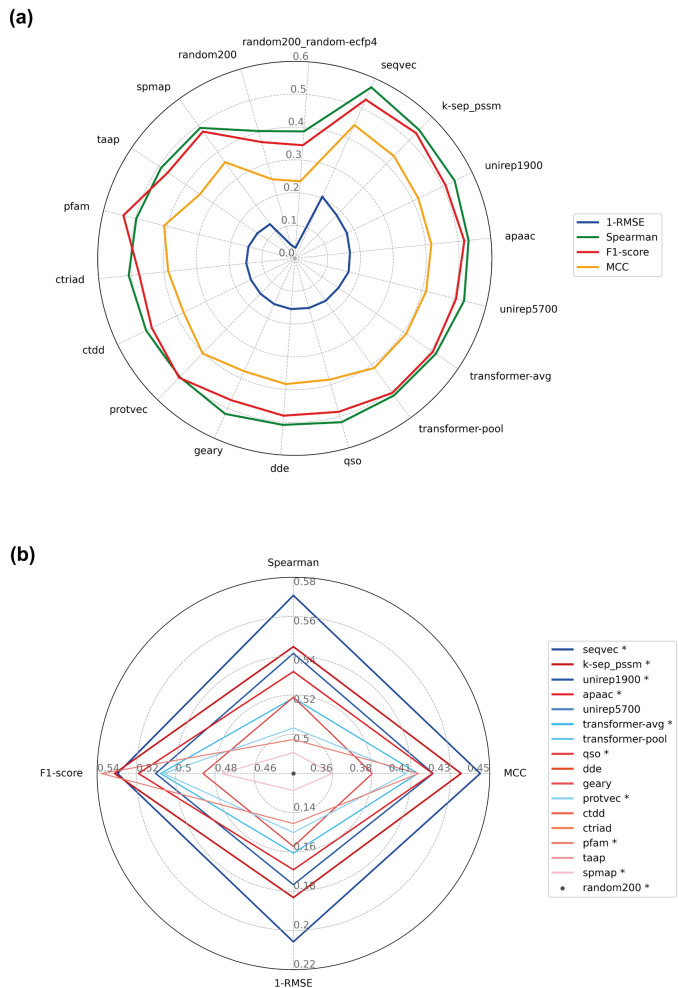
Fig. 7.
Test performance results of medium-scale PCM models (on the mDavis dataset) based on RMSE (the scores are reported as 1-RMSE, so higher values represent better performance), Spearman’ s rank correlation, MCC and F1-score; (a) each color corresponds to an evaluation metric, and (b) scores are displayed only for the selected representative models (marked with asterisk in the legend). The ranking in the legend is based on the models' performance from best to worst according to their RMSE scores. Shades of red and blue represent conventional descriptors and learned representations, respectively

