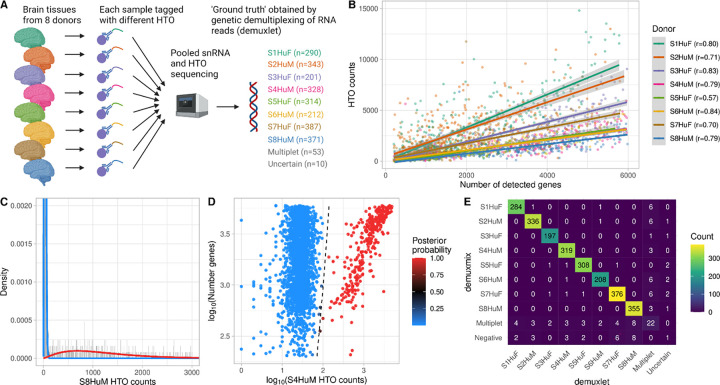
Fig. 1. demuxmix results from the human brain single-nucleus dataset.
A) Experimental design of the human brain single-nucleus dataset. B) Scatter plot shows the correlation between the number of detected genes and HTO counts. Shown are the counts of the HTO used to tag the respective nucleus as determined by genetic demultiplexing. Regression lines are plotted, and Pearson correlation coefficients are shown in the legend. C) Histogram depicts the distribution of an exemplary HTO (S8HuM) overlaid by the probability mass functions of the negative (blue) and the positive (red) component of the mixture model. D) Scatter plot shows the relation between HTO counts (x-axis), the number of detected genes (y-axis), and the posterior probability for the droplet containing a cell tagged by the HTO (color) obtained from the model. The black dashed curve indicates the decision boundary where the posterior probability equals 0.5. E) Matrix displays the concordance between the droplet classifications obtained from genetic demultiplexing by demuxlet (x-axis) and demuxmix (y-axis).

