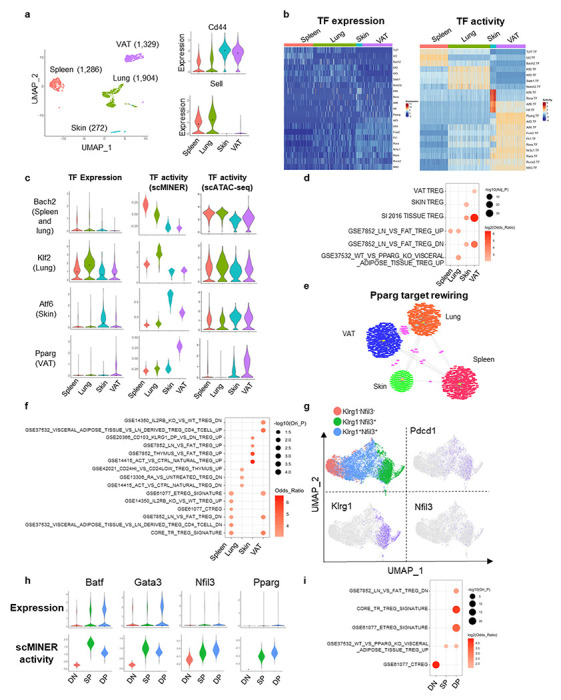
Figure 6: Tissue-specific differentiation of Treg identified by scMINER.

a, MICA MDS clustering of mouse Foxp3+ regulatory CD4+ T cells (GSE130879) isolated from spleen, lung, skin and visceral adipose tissue (VAT). The expression of Cd44 and Sell is visualized by violin plots. b, Heatmap visualization of predicted activity of top TFs in each cell from spleen, muscle, colon and VAT Treg cells. c, Violin plot visualization of Bach2, Klf2, Atf6 and Pparg expression, scMINER activity, scATAC gene activity in spleen, muscle, colon and VAT Treg cells. scATAC gene activity was by signac R package based on GSE156112. d, Functional pathway enrichment of a union of top 50 TFs and top 200 SIGs in each tissue Treg cells based on t value from Student’s t test. e, The regulons of Pparg in spleen (red), lung (orange), skin (green) and VAT (blue) Treg cells. Regulons shared by 2 or more cell types are highlighted as pink. f, Functional pathway enrichment of Pparg regulons in spleen, muscle, colon and VAT Treg cells. g, MICA MDS clustering of mouse Klrg1−Nfi13−, Klrg1−Nfil3+, Klrg1+Nfil3+ Treg cells isolated from spleen (GSE130879). Pdcd1, Klrg1 and Nfil3 expression are visualized on UMAP. h, Violin plot visualization of Batf, Gata3, Nfil3 and Pparg expression and activity in spleen, muscle, colon and VAT Treg cells. i, Functional pathway enrichment of a union of top 50 TFs and top 200 SIGs in each stage of spleen Treg cells.
