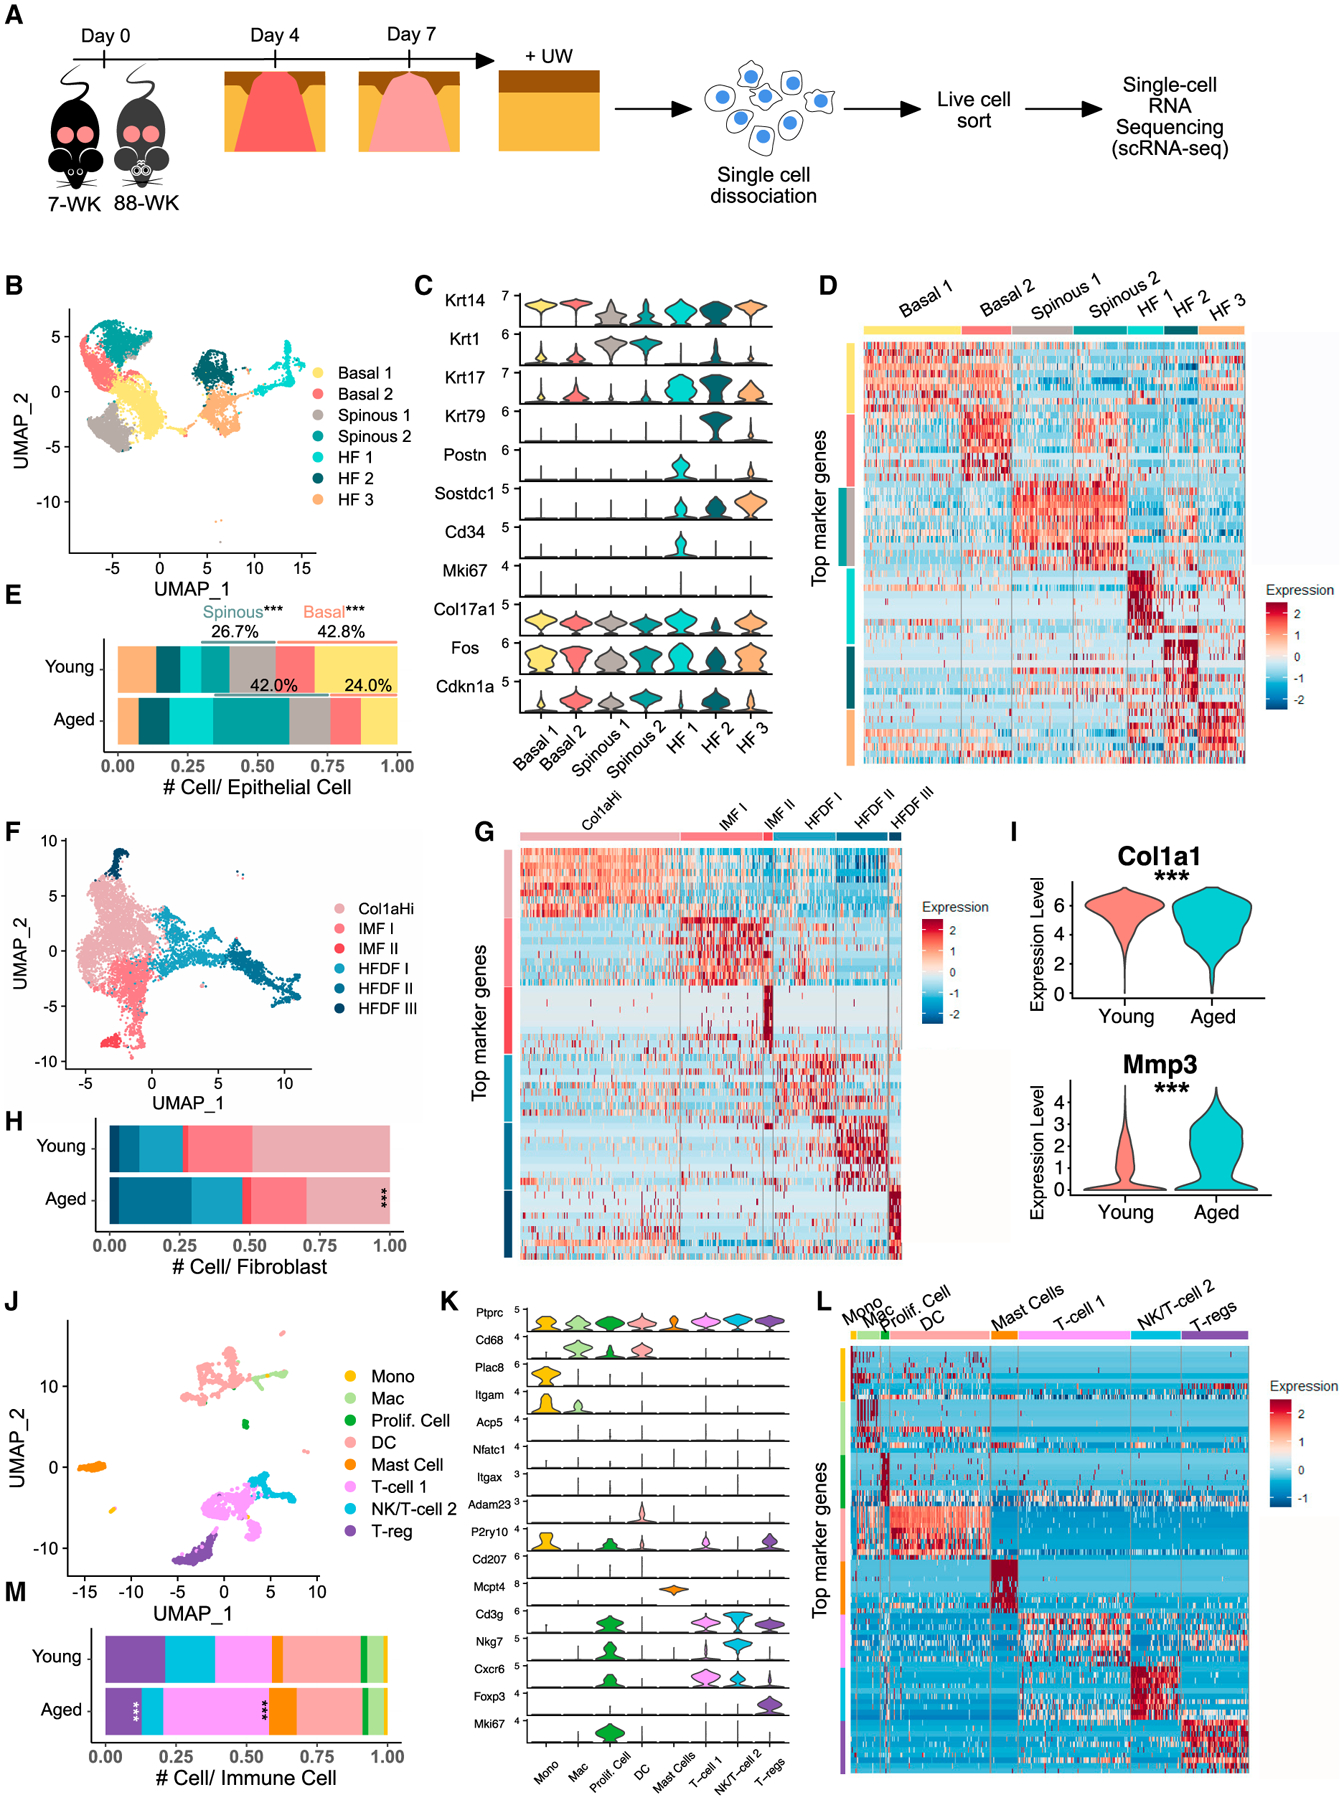
Figure 1. Heterogeneity of epidermal cells, fibroblasts, and immune cells in young and aged skin during homeostasis.

(A) Schematic diagram detailing single-cell isolation and collection.
(B) Uniform manifold approximation and projection (UMAP) of epithelial cells in young and aged UW skin.
(C) Expression of marker genes used for identification of major cell types in (B).
(D) Heatmap of top 10 differentially expressed marker genes of clusters in (B).
(E) Proportion of each epithelial subpopulation out of all epithelial cells in (B).
(F) UMAP of fibroblasts in young and aged UW skin.
(G) Heatmap of top 10 differentially expressed marker genes of clusters in (F).
(H) Proportion of each fibroblast subpopulation out of all fibroblasts in (F).
(I) Col1a1/Mmp3 expression in Col1aHi/IMF I/II fibroblasts from (F). See Table S1 for full list of differentially expressed genes.
(J) UMAP of immune cells in young and aged UW skin.
(K) Expression of marker genes used for identification of major cell types in (J).
(L) Heatmap of top 10 differentially expressed marker genes of clusters in (J).
(M) Proportion of each immune subpopulation out of all immune cells in (J). p values were calculated using prop.test function in R (E, H, and M) or Wilcoxon rank sum test (I). ***p < 0.001. Data presented in Figures 1–4 include both v2 and v3 samples unless specified otherwise.
