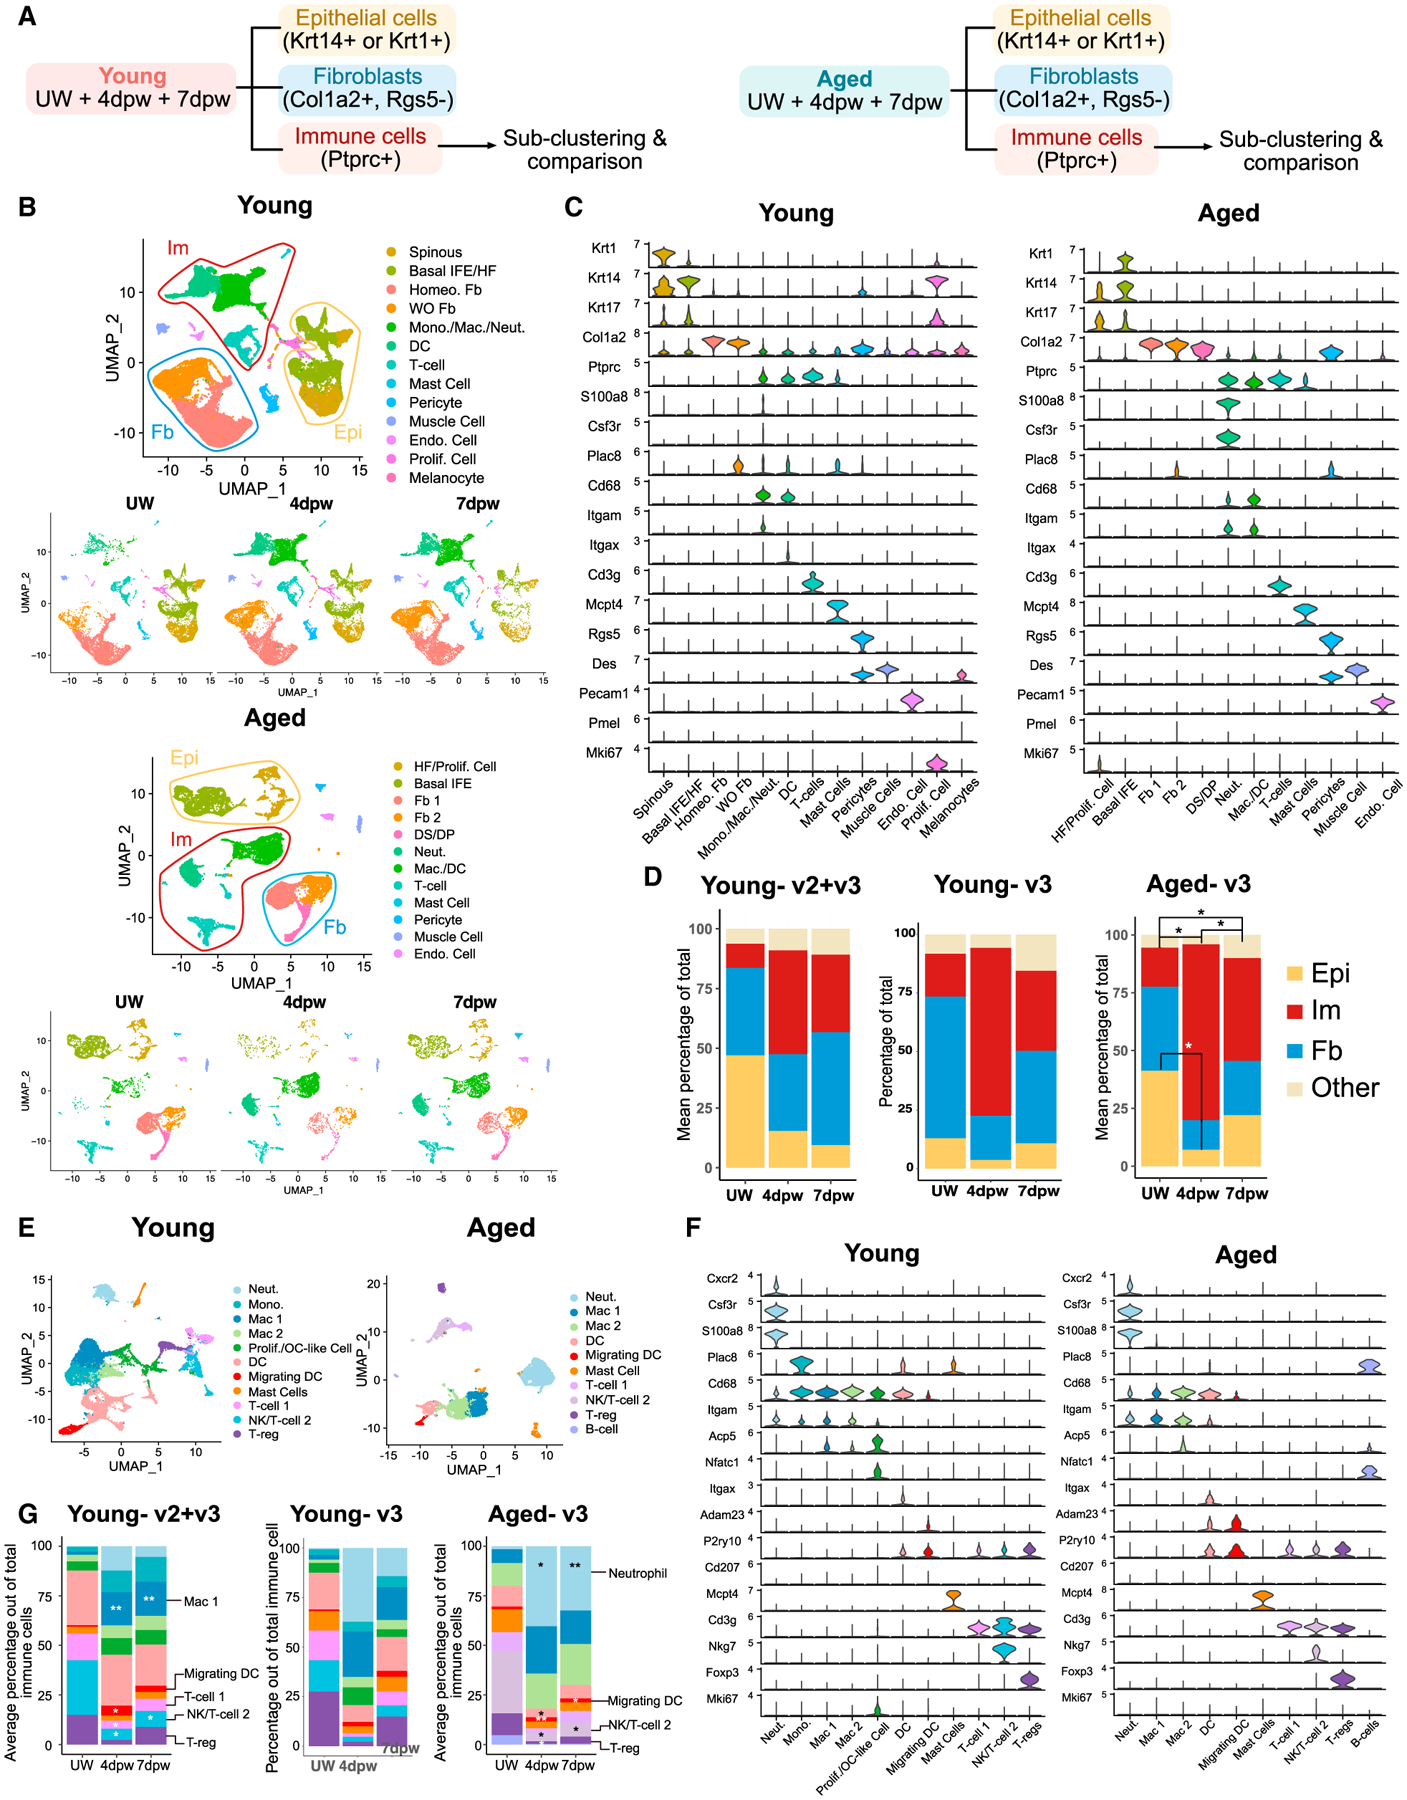
Figure 2. Cellular changes during wound healing in young or aged skin.

(A) Data analysis strategy. Young and aged samples are analyzed separately here.
(B) UMAPs of all cells in UW and wounded (4dpw and 7dpw) skin in young or aged samples.
(C) Expression of marker genes used for identification of cell populations in (B).
(D) Proportion of each major cell type out of all cells in (B) at the indicated timepoints. Epi, epithelial; Im, immune; Fb, fibroblast.
(E) UMAP of immune cells in young or aged samples.
(F) Expression of marker genes used for identification of cell populations in (E).
(G) Proportion of each immune population out of all immune cells in (E). p values were calculated using ANOVA and post hoc Tukey tests in R. **p < 0.01, *p < 0.05 compared with UW samples.
