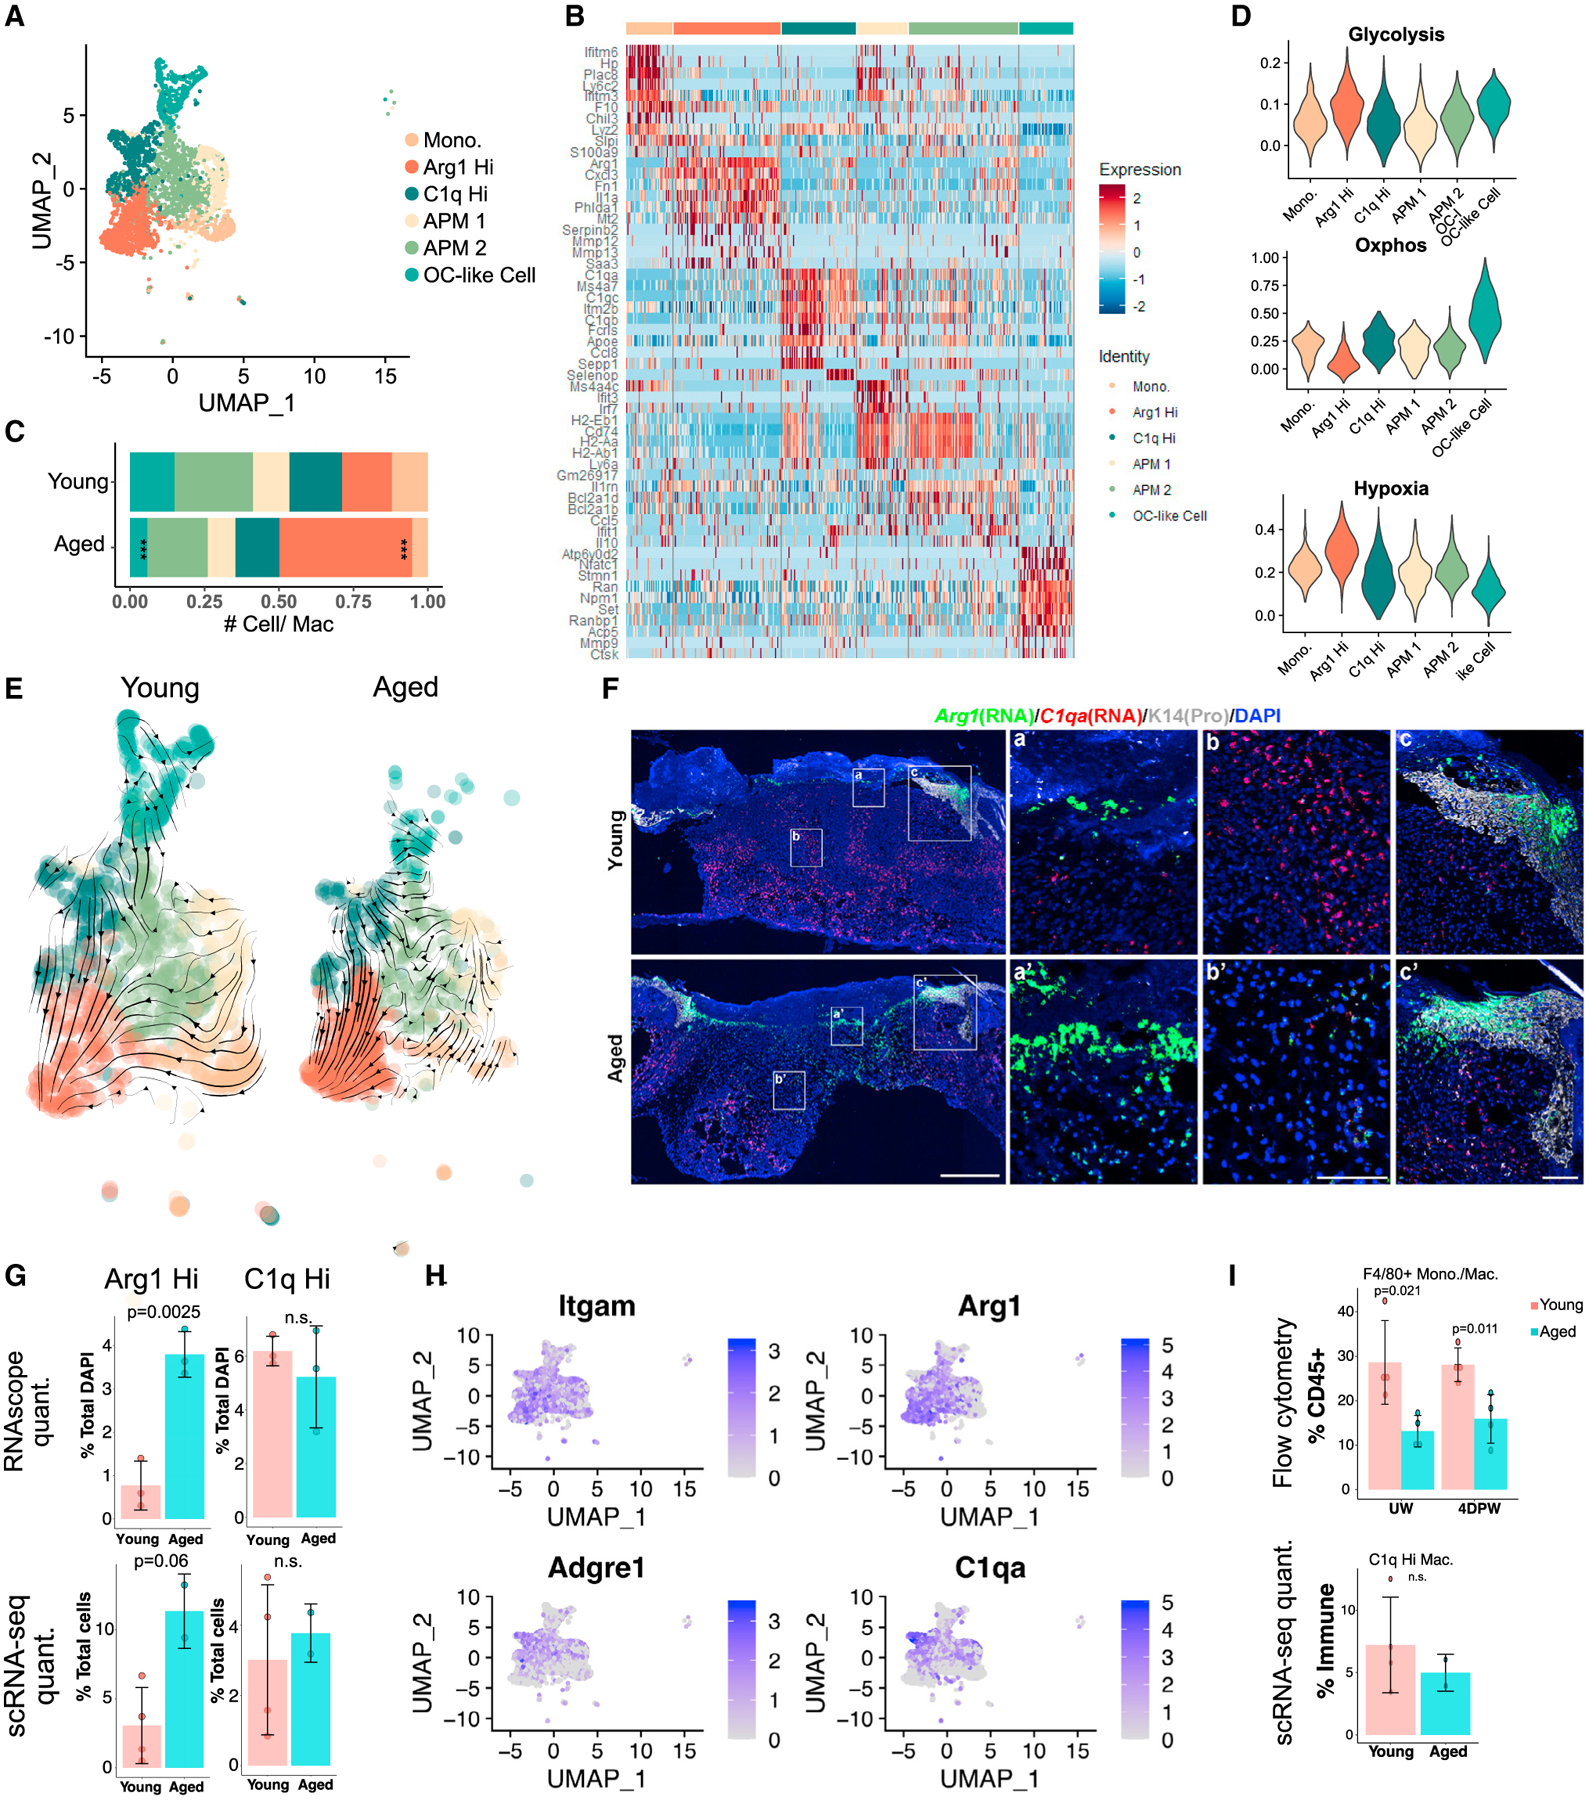
Figure 4. Differential macrophage heterogeneities in young versus aged skin wounds.

(A) UMAP of macrophage subpopulations in young + aged 4dpw wounds.
(B) Heatmap of top 10 differentially expressed marker genes of clusters in (A).
(C) Proportion of each macrophage subpopulation out of all monocyte/macrophages in (A).
(D) Gene scoring analysis of the macrophage subpopulations in (A).
(E) RNA velocity analysis of macrophages in (A).
(F) RNAScope showing spatial distribution of Arg1 and C1qa transcripts in young and aged 4dpw wounds (n = 3 each). DAPI stains the nuclei. Scale bars: 500 μm in low-magnification image (left), 100 μm in high-magnification images (middle, right).
(G) Quantification of percentage Arg1+ or C1qa+ cells per total DAPI-positive cells from RNAScope results in (F) (top) or percentage Arg1+ or C1q+ cells per total live cells from scRNA-seq experiments (bottom).
(H) Feature plots showing expression of the indicated genes in macrophage subpopulations from (A).
(I) Flow cytometry of F4/80+ macrophages in UW and 4dpw skin (top). n = 4 each for young and aged samples. Bottom, percentage C1q+ macrophages per total immune cells from scRNA-seq data. Bar graphs (G and I) represent mean ± SD. p values were calculated using prop.test function in R (C) or unpaired two-tailed Student’s t test (G and I). ***p < 0.001.
