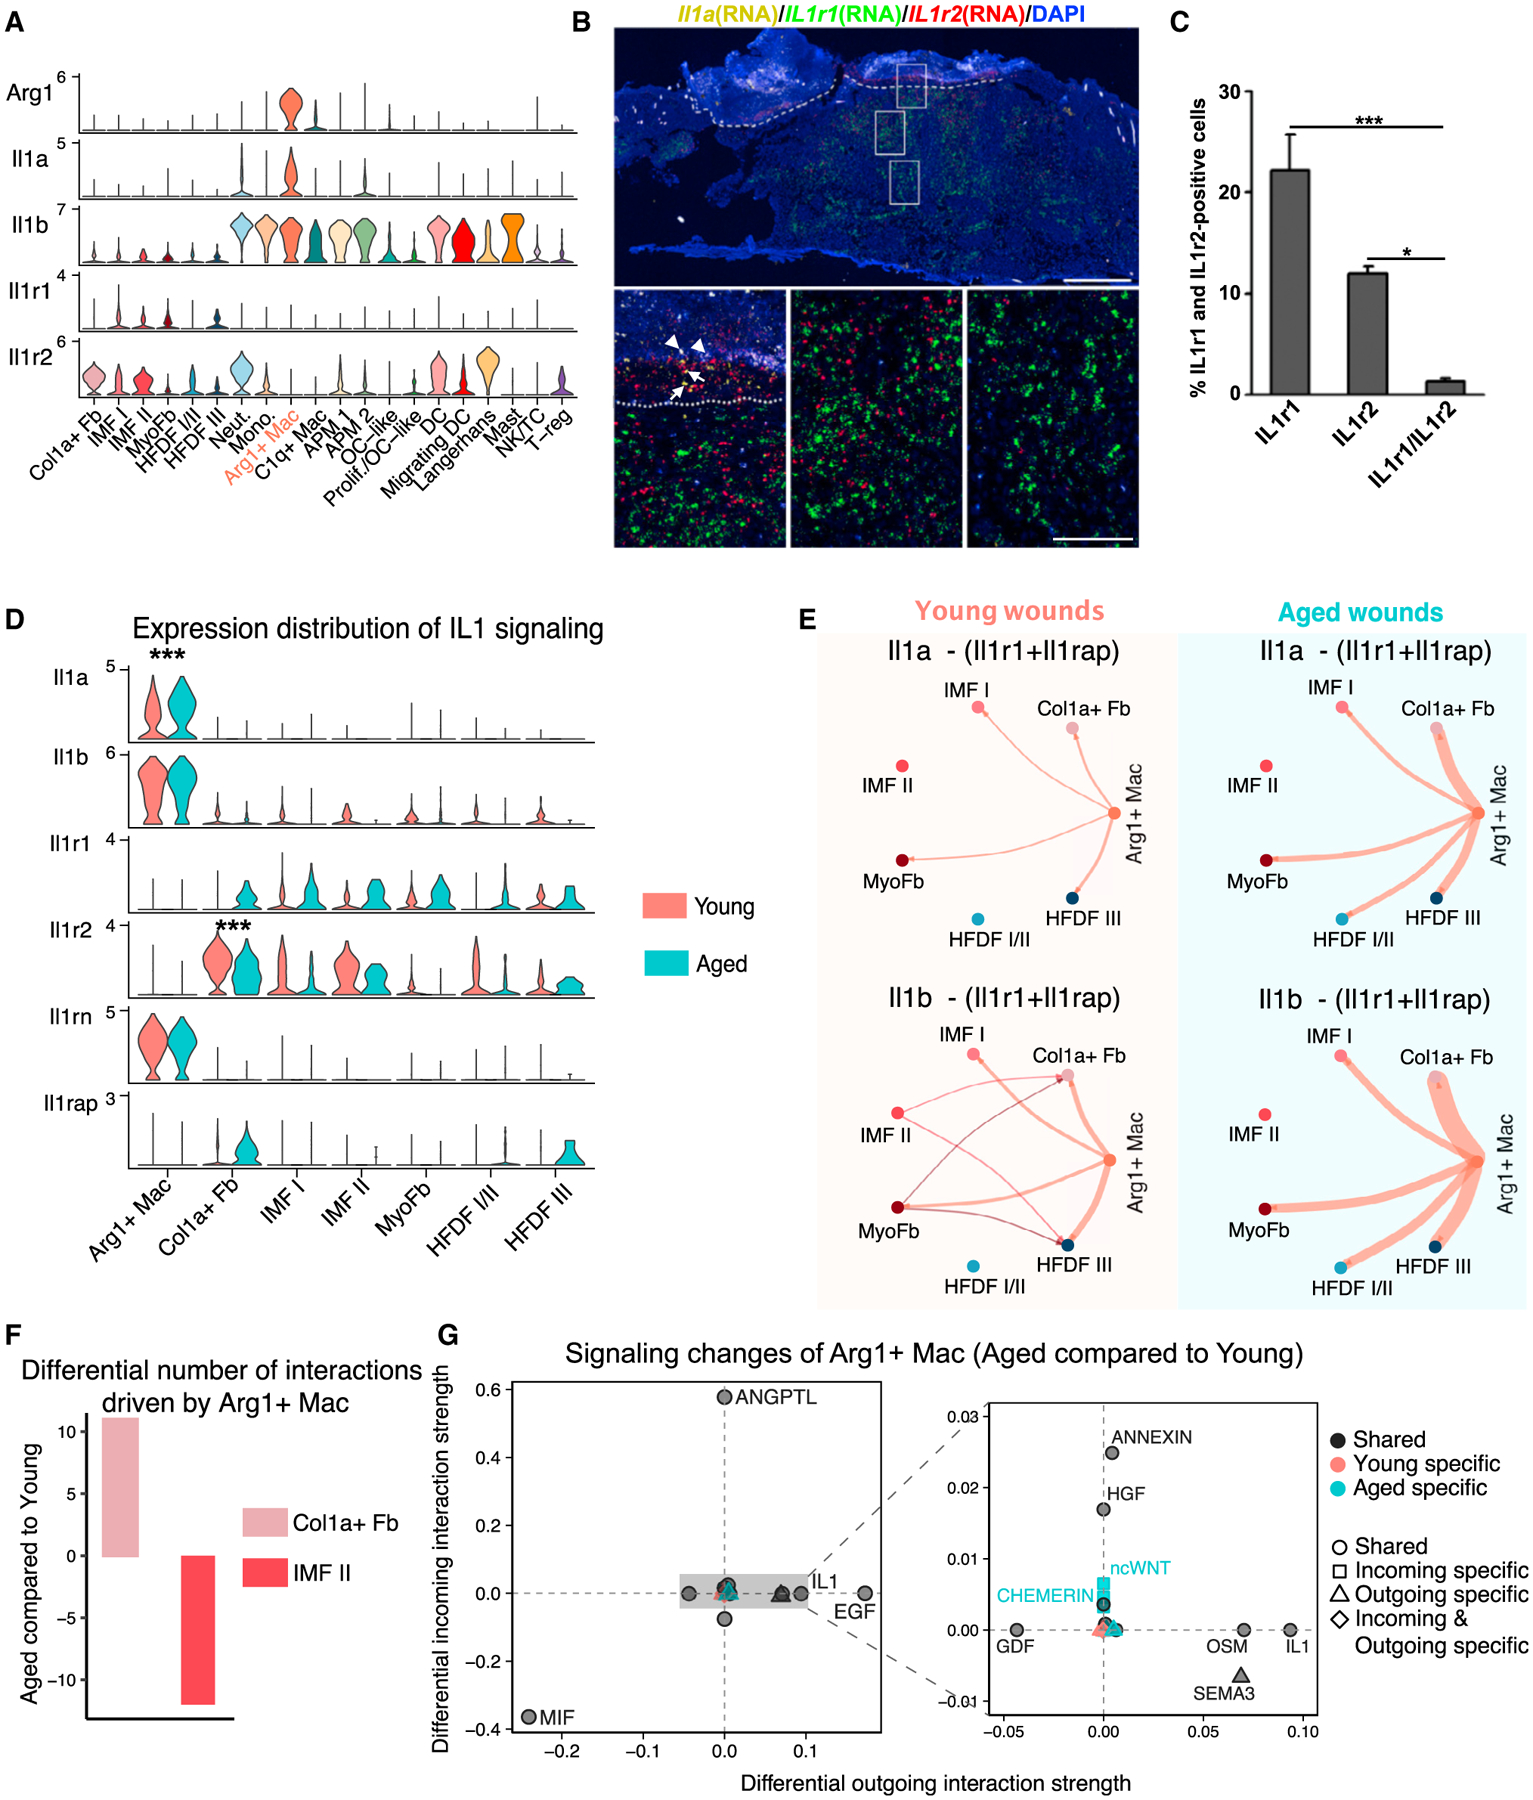
Figure 5. Differential Arg1Hi macrophage-associated signaling in young versus aged 4dpw wounds.

(A) Violin plots showing expression levels of the indicated genes in fibroblast and immune cell populations.
(B) RNAScope showing spatial distribution of Il1a, Il1r1, and Il1r2 transcripts in young 4dpw wound. Arrows and arrowheads indicate Il1a and background signals, respectively. Dashed line indicates scab-wound bed border. DAPI stains the nuclei. Scale bars: 500 μm in low-magnification image (top), 100 μm in high-magnification images (bottom).
(C) Quantitation of Il1r1-, Il1r2-, and Il1r1/Il1r2-positive cells in wound beds (B). n = 3.
(D) Comparison of expression levels of IL-1 signaling components in Arg1Hi macrophages and fibroblasts in young versus aged skin wounds.
(E) IL-1-mediated cell-cell communication networks between Arg1Hi macrophages and fibroblast populations in young versus aged skin wounds. Edge width is proportional to the inferred interaction strength. Edge color is consistent with the signaling source.
(F) Differential number of putative interactions driving Arg1Hi macrophage-to-fibroblast signaling in aged versus young skin wounds.
(G) Altered Arg1Hi macrophage-associated signaling pathways in young versus aged skin wounds. The x and y axes represent differential outgoing and incoming interaction strengths, respectively. Positive and negative values indicate increased and decreased signaling, respectively, in aged skin wounds compared with the young. Black, red, and green colors indicate whether a signaling pathway is shared between young and aged, or specific to either young or aged. Dot shapes indicate whether a signaling pathway is specific to either young or aged in its outgoing, incoming, or both outgoing and incoming signaling. Enlarged plot on the right shows the signaling pathways with relatively small alterations. Data presented in Figures 5–7 infer cell signaling from v2 + v3 samples unless specified otherwise. Cell-cell communication information that is qualitatively consistent between v2 + v3 and v3-only data analyses is shown in the main figures, whereas v3-only information is shown in supplemental figures. p values were calculated using unpaired two-tailed Student’s t test (C) or Wilcoxon rank sum test (D). ***p < 0.001, *p < 0.05.
