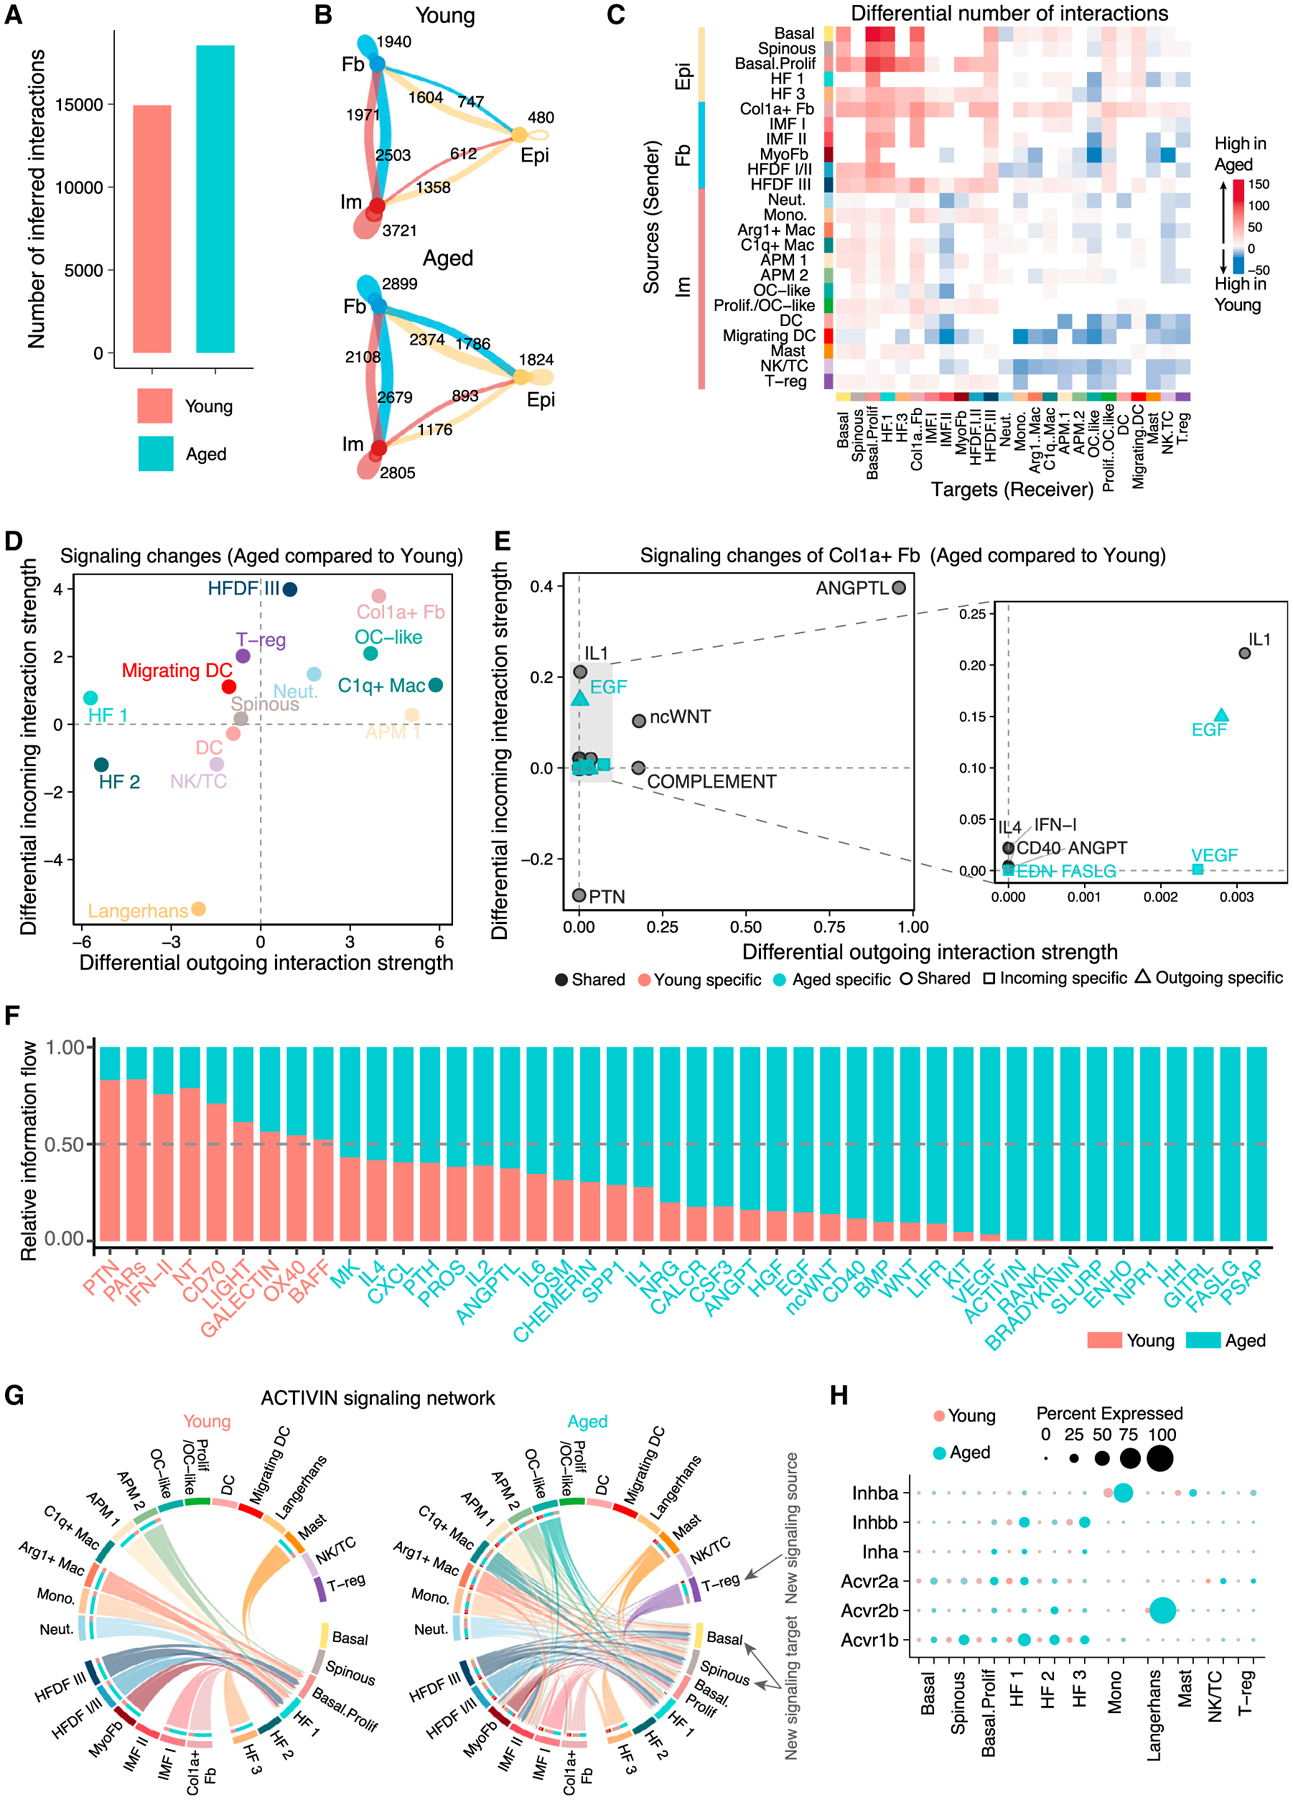
Figure 6. Alterations in network structure and signaling strength of putative cell-cell communications in young versus aged 4dpw wounds.

(A) Total number of possible interactions.
(B) Number of possible interactions between the three major cell types.
(C) Differential number of possible interactions between any two cell populations. Red (positive values) and blue (negative values) in the color bar indicate higher number of predicted interactions in aged and young skin wounds, respectively.
(D) Differential interaction analysis identifying prominently altered signaling sources and targets.
(E) Altered signaling pathways that associate with Col1aHi fibroblasts. See Figure 5G legends for more details.
(F) Significant signaling pathways were ranked based on their differences of overall information flow, calculated by summarizing all communication probabilities in a given inferred network. Those colored red and green are more enriched in young and aged skin wounds, respectively.
(G) Chord diagrams of inferred ACTIVIN signaling networks. Edge color is consistent with the signaling source. Segments with large arrows represent signaling targets and inner bars represent signaling sources in which the colors indicate signaling targets.
(H) Comparison of expression levels of ACTIVIN signaling components in epithelial and immune cells in young versus aged skin wounds.
