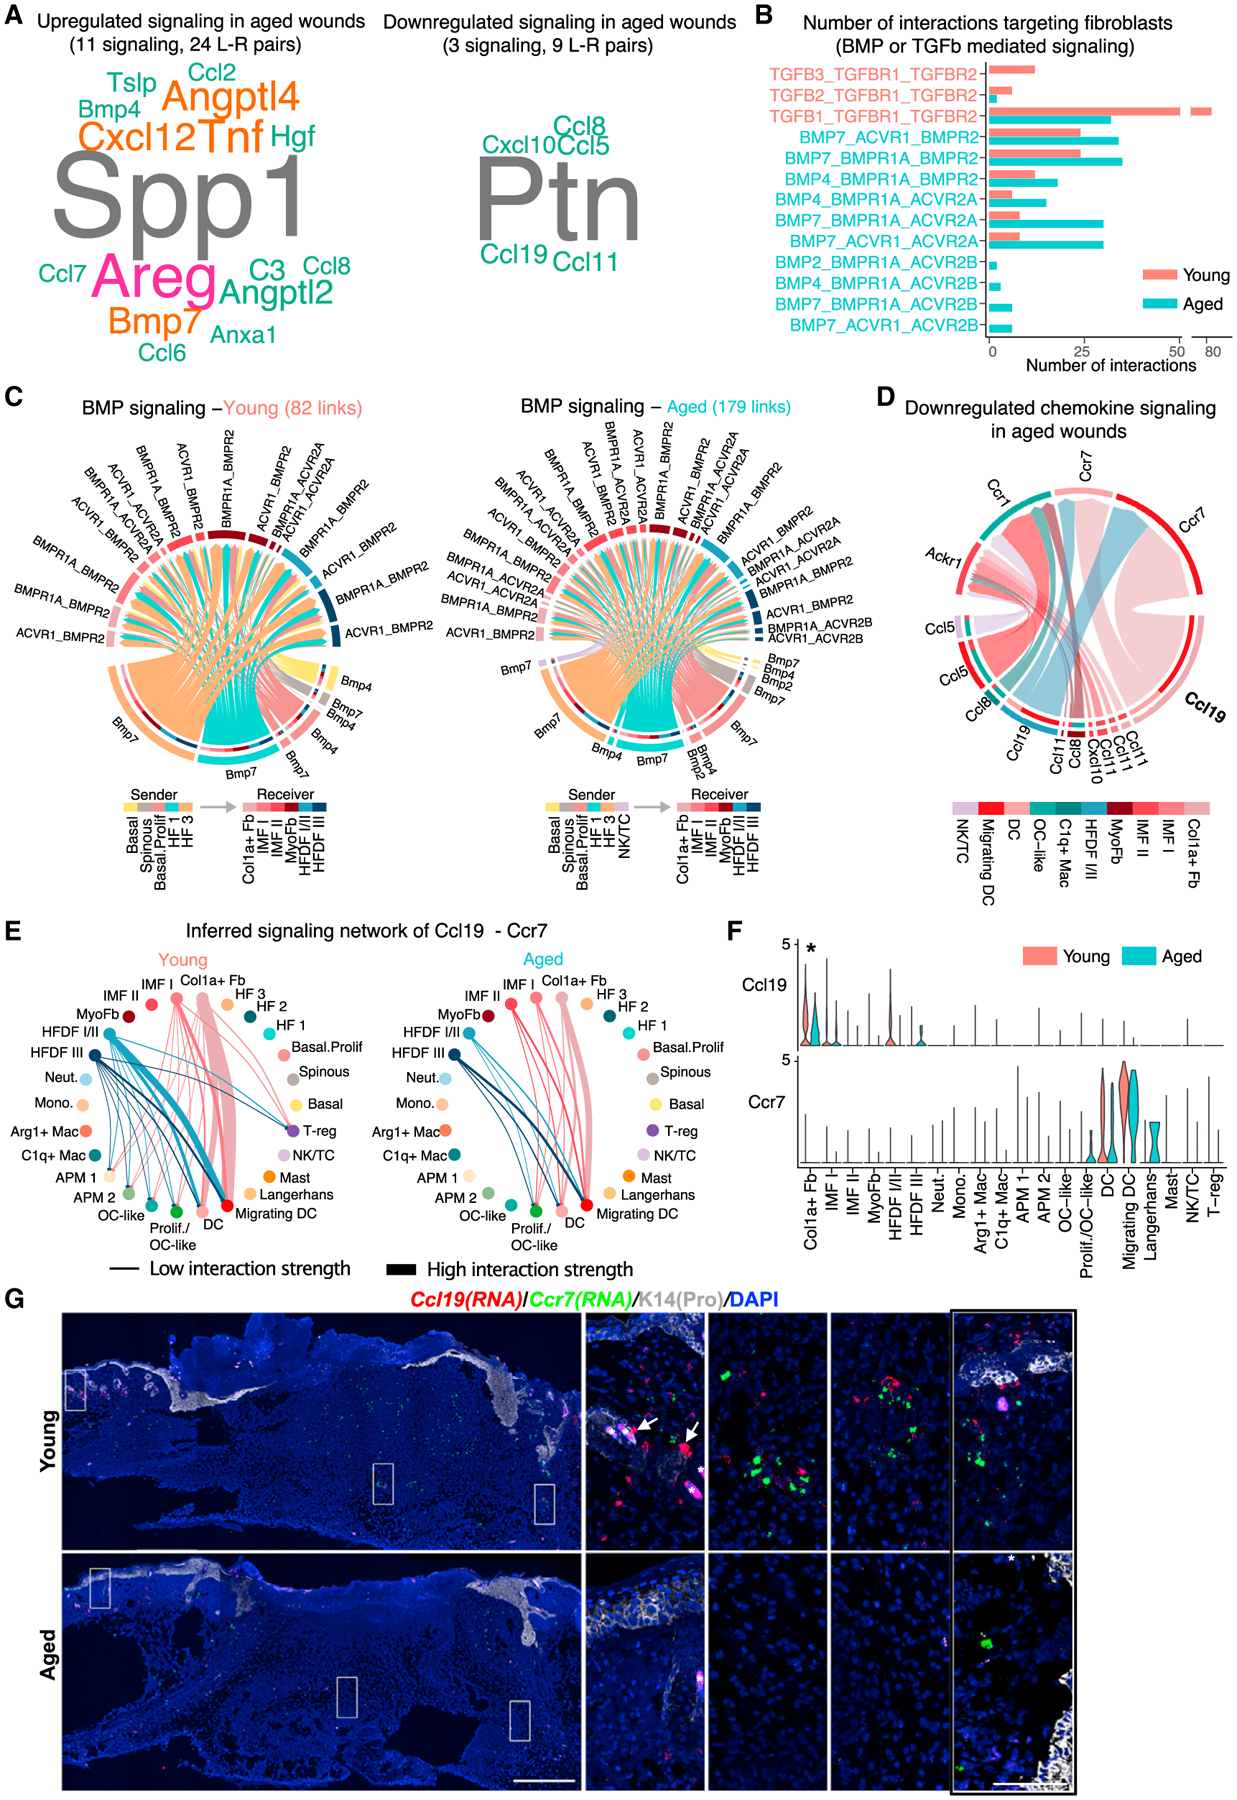
Figure 7. Dysregulated growth factor, chemokine, and cytokine signaling in aged 4dpw wounds.

(A) Word cloud showing upregulated (left) and downregulated (right) signaling ligands in aged skin wounds compared with the young. Word size indicates the extent of enrichment in aged or young skin wounds.
(B) Number of possible interactions targeting wound fibroblasts via BMP or TGF-β signaling.
(C) Inferred BMP-mediated communications from non-fibroblast subsets to fibroblast subsets. The number of putative interactions (i.e., links in the diagram) is indicated on the top.
(D) Downregulated chemokine signaling in aged skin wounds compared with the young. Signaling sources and target are shown on the bottom and top, respectively. Colored segments indicate their cell identity information. Segment size is proportional to the total outgoing or incoming interaction strength associated with each ligand-receptor pair in the corresponding cell subpopulation.
(E) Circle plots of inferred Ccl19-Ccr7 signaling networks.
(F) Comparison of expression levels of Ccl19 and Ccr7 in epithelial, fibroblast, and immune cells in young versus aged skin wounds. *p < 0.05 (calculated using Wilcoxon rank sum test).
(G) RNAScope showing spatial distribution of Ccl19 and Ccr7 transcripts in young and aged skin wounds. DAPI stains the nuclei. Arrows point to Ccl19-positive cells that line HFs, and asterisk (*) indicates hair shaft autofluorescence. See Figure S7M for quantification (n = 3 pairs). Scale bars: 500 μm in low-magnification image (left), 100 μm in high-magnification images (right). The rightmost panel shows high-magnification image of an area near the wound margin from Figure S7L.
