
Fig. 2.
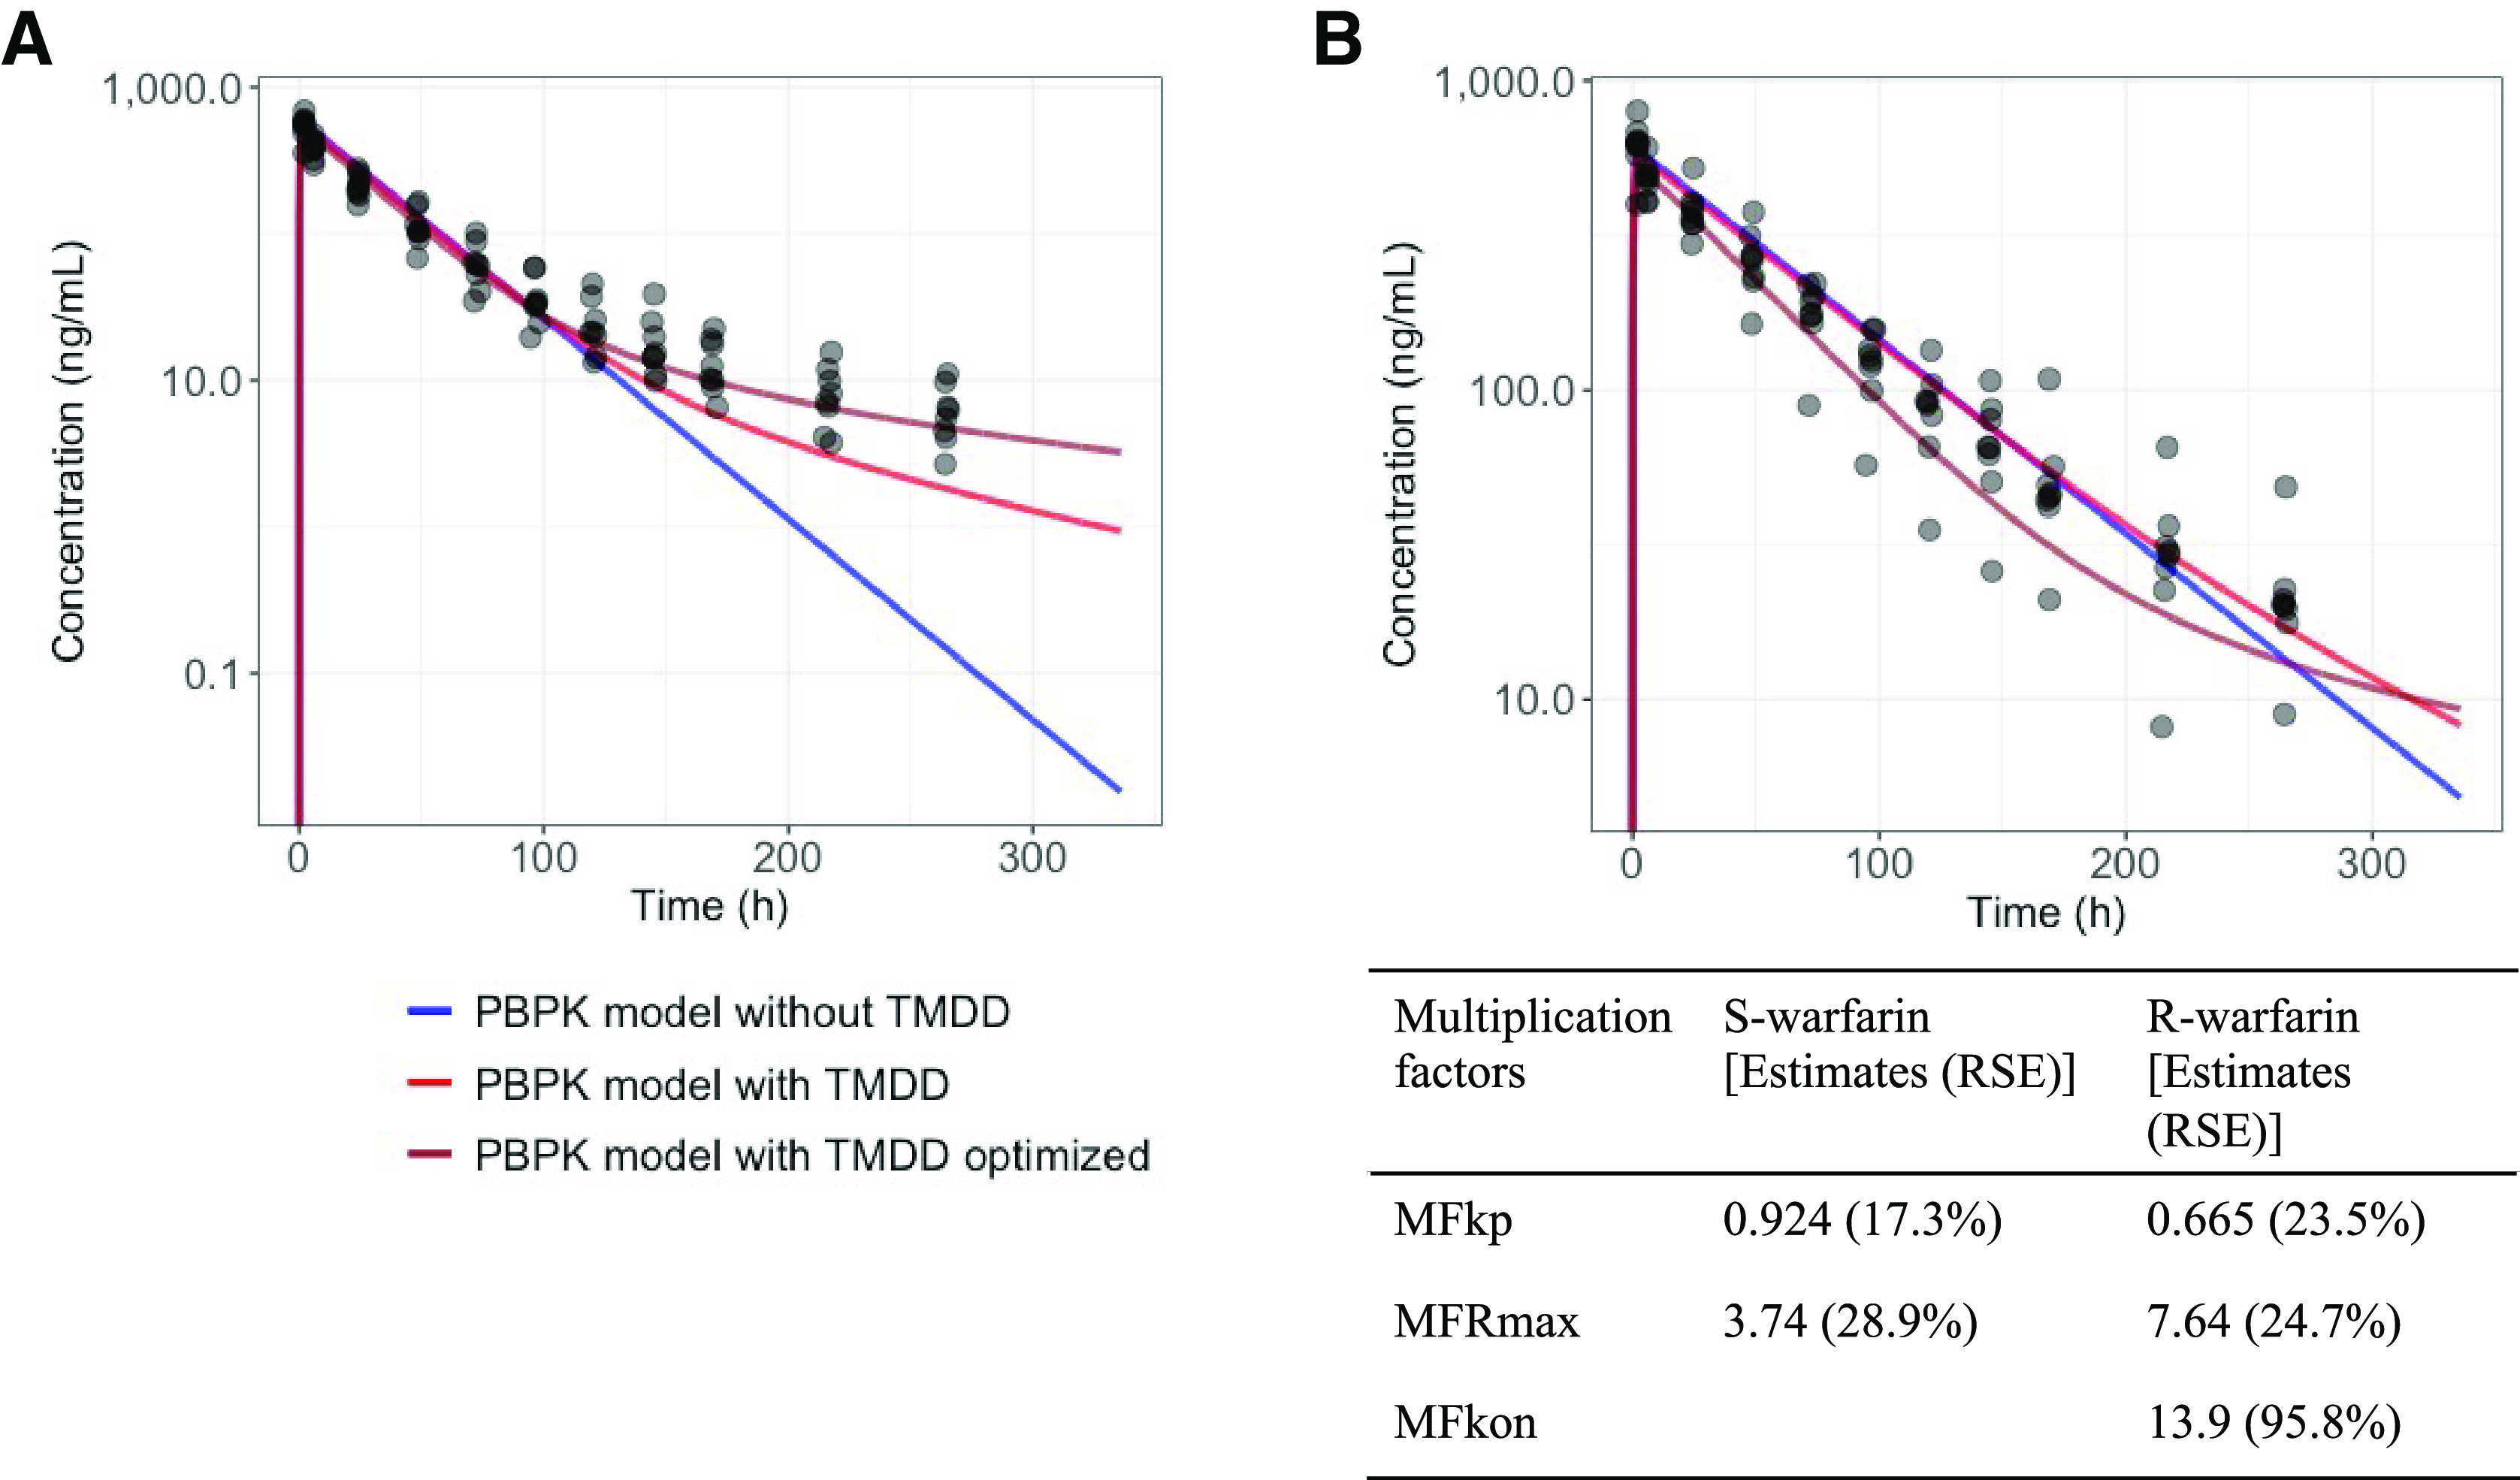
S-warfarin (A) and R-warfarin (B) PBPK model predictions in subjects with CYP2C9 *1/*1 when warfarin is administrated alone. Colors represent model predictions using a PBPK model without TMDD mechanism, with TMDD mechanism, and with TMDD mechanism following optimization. Table displays the multiplication factors for S- and R-warfarin following optimization. The multiplication factors are estimated based on the assumption that the volume of saturable binding target of warfarin is 1 L (arbitrarily fixed due to lack of relevant clinical information). RSE, relative standard errors.