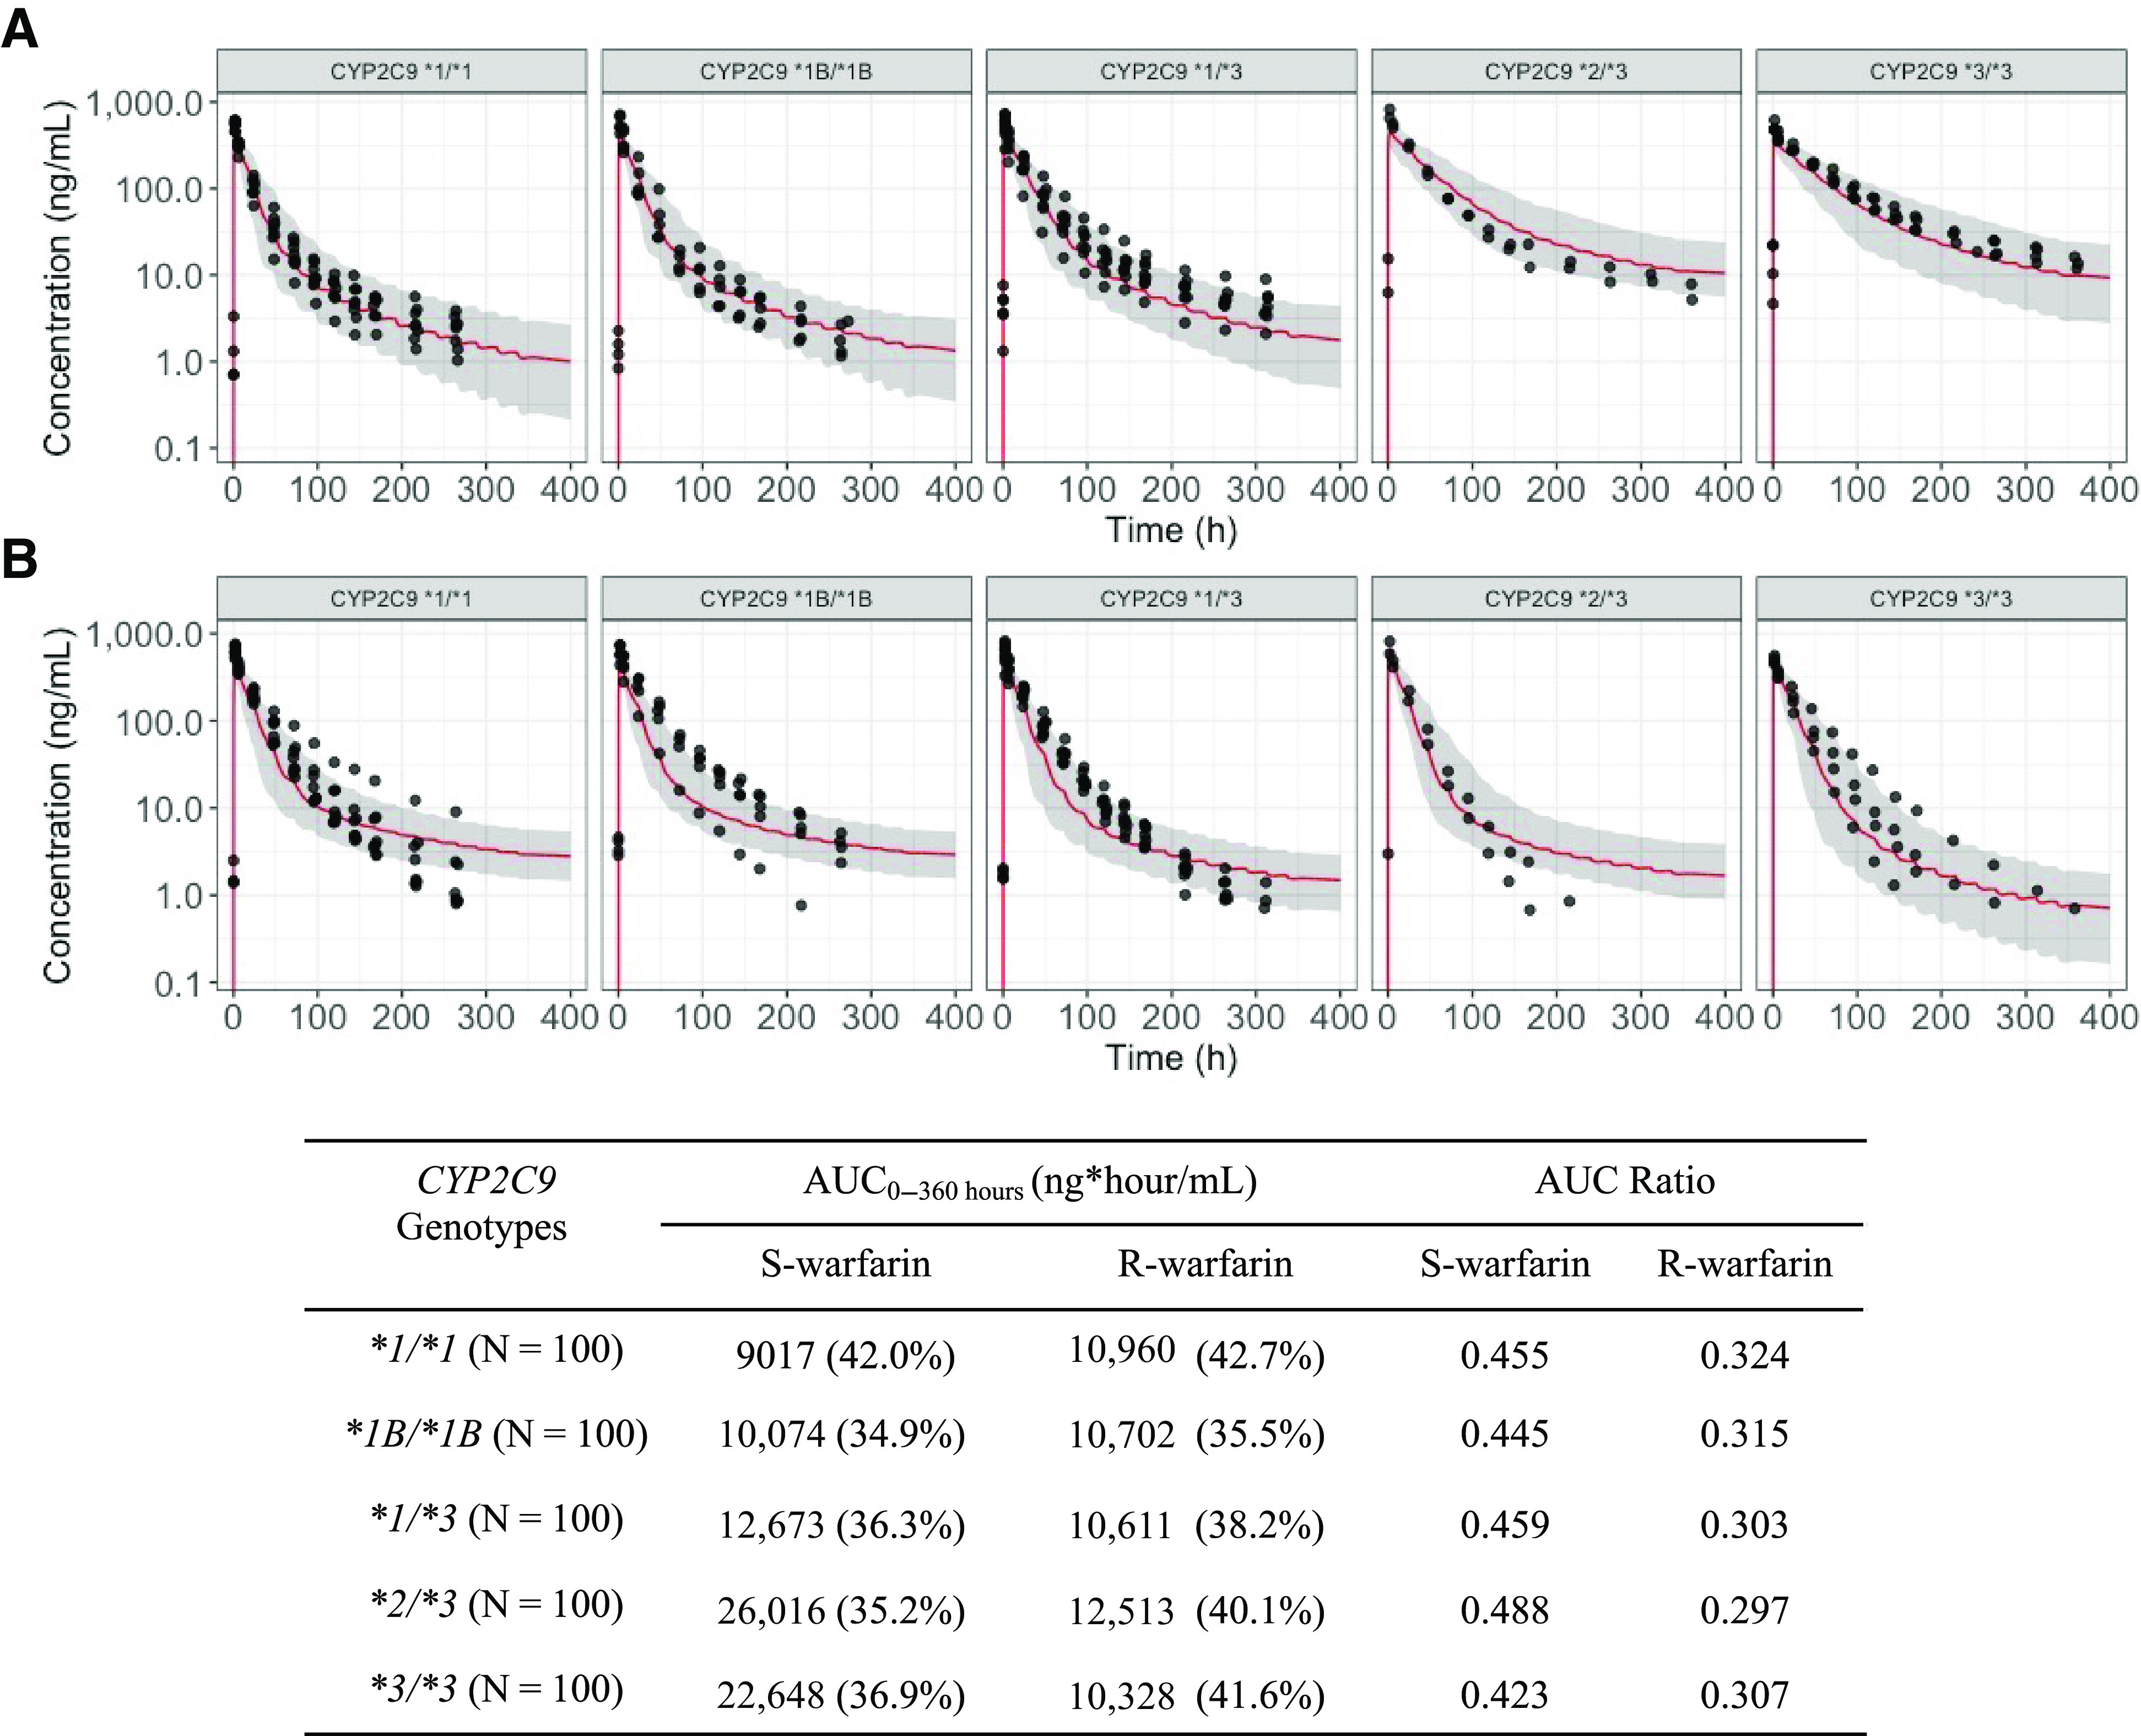
Fig. 6.

Optimized S-warfarin (A) and R-warfarin (B) PBPK model with TMDD mechanism population predictions overlaid with observations in subjects with various CYP2C9 genotypes when warfarin is administered together with rifampin. Dots represent observations. Red lines represent median predictions. Gray-shaded areas represent the area between 5th and 95th percentiles of the model predictions. Table inset shows the AUC0–360 hours and AUC ratios of S- and R-warfarin by CYP2C9 genotypes when warfarin is coadministered with rifampin. Values in table expressed as geometric means (coefficient of variations). AUC0–360, area under the curve from time 0 to 360 hours.
