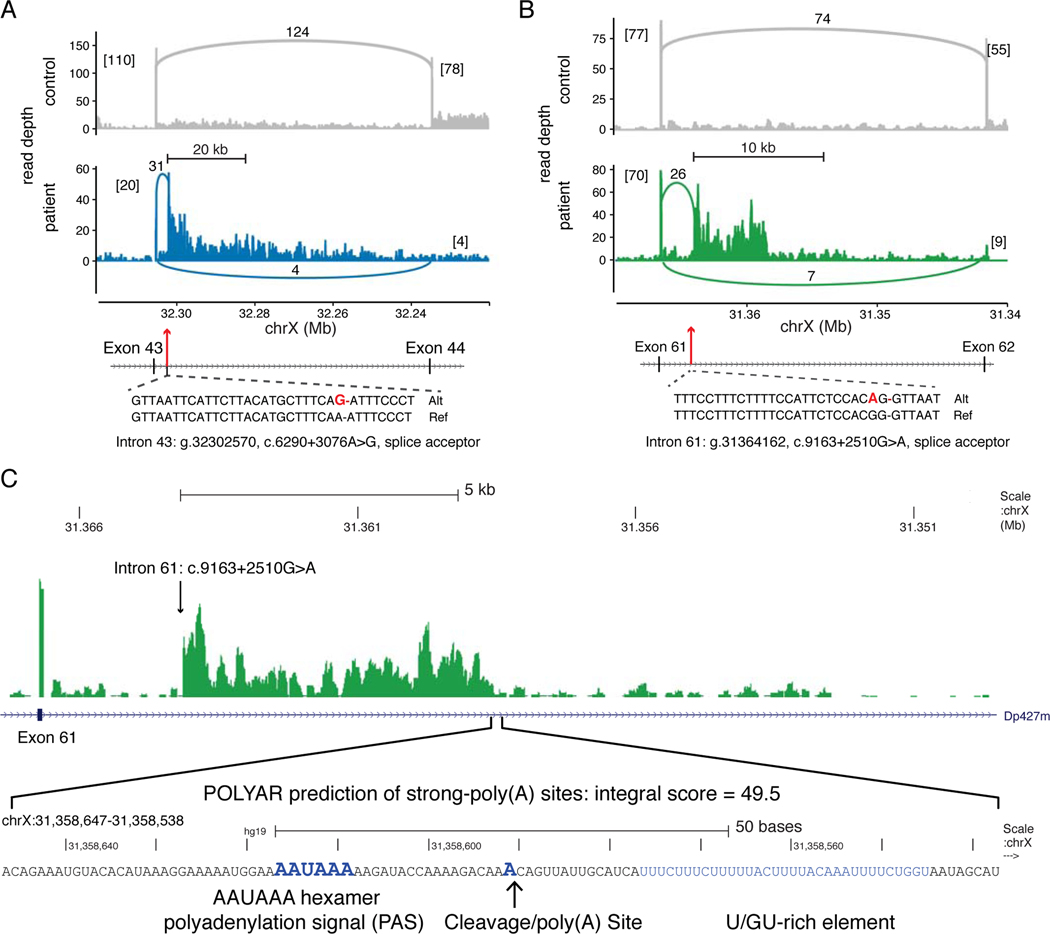
Figure 3. Type 1C Intronic DMD Mutations Activate Intronic Splice Acceptor Sites.
(A) Coverage plots of stranded, total RNA-Seq reads mapped to the DMD exon 43 – intron 43 – exon 44 region (hg19, chrX:32.32–32.22 Mb). The lower panel (blue) displays mapped reads from the intron 43 c.6290+3076A>G patient, compared to reads from a control muscle biopsy (upper panel, gray). Exon and pseudoexon junction read counts are shown as numbers alongside connecting arcs. Numbers in brackets are flanking exon junction read counts. The cryptic splice acceptor site activating mutation (bold red) is shown relative to the reference sequence. (B) Coverage plots for mapped reads in the DMD exon 61 – intron 61 – exon 62 region (chrX:31.37–31.34 Mb) from the intron 61 c.9163+2510G>A patient (lower panel, green) versus a control biopsy (upper panel, gray). (C) The read depth for the intron 61 c.9163+2510G>A patient is zoomed to the intron 60 – exon 61 – intron 61 region (chrX:31,349,600–31,367,400) and then to the 100 nucleotide region (chrX:31,358,538–31,358,647) with an abrupt decrease in read depth coinciding with a POLYAR predicted strong cleavage and polyadenylation site.

