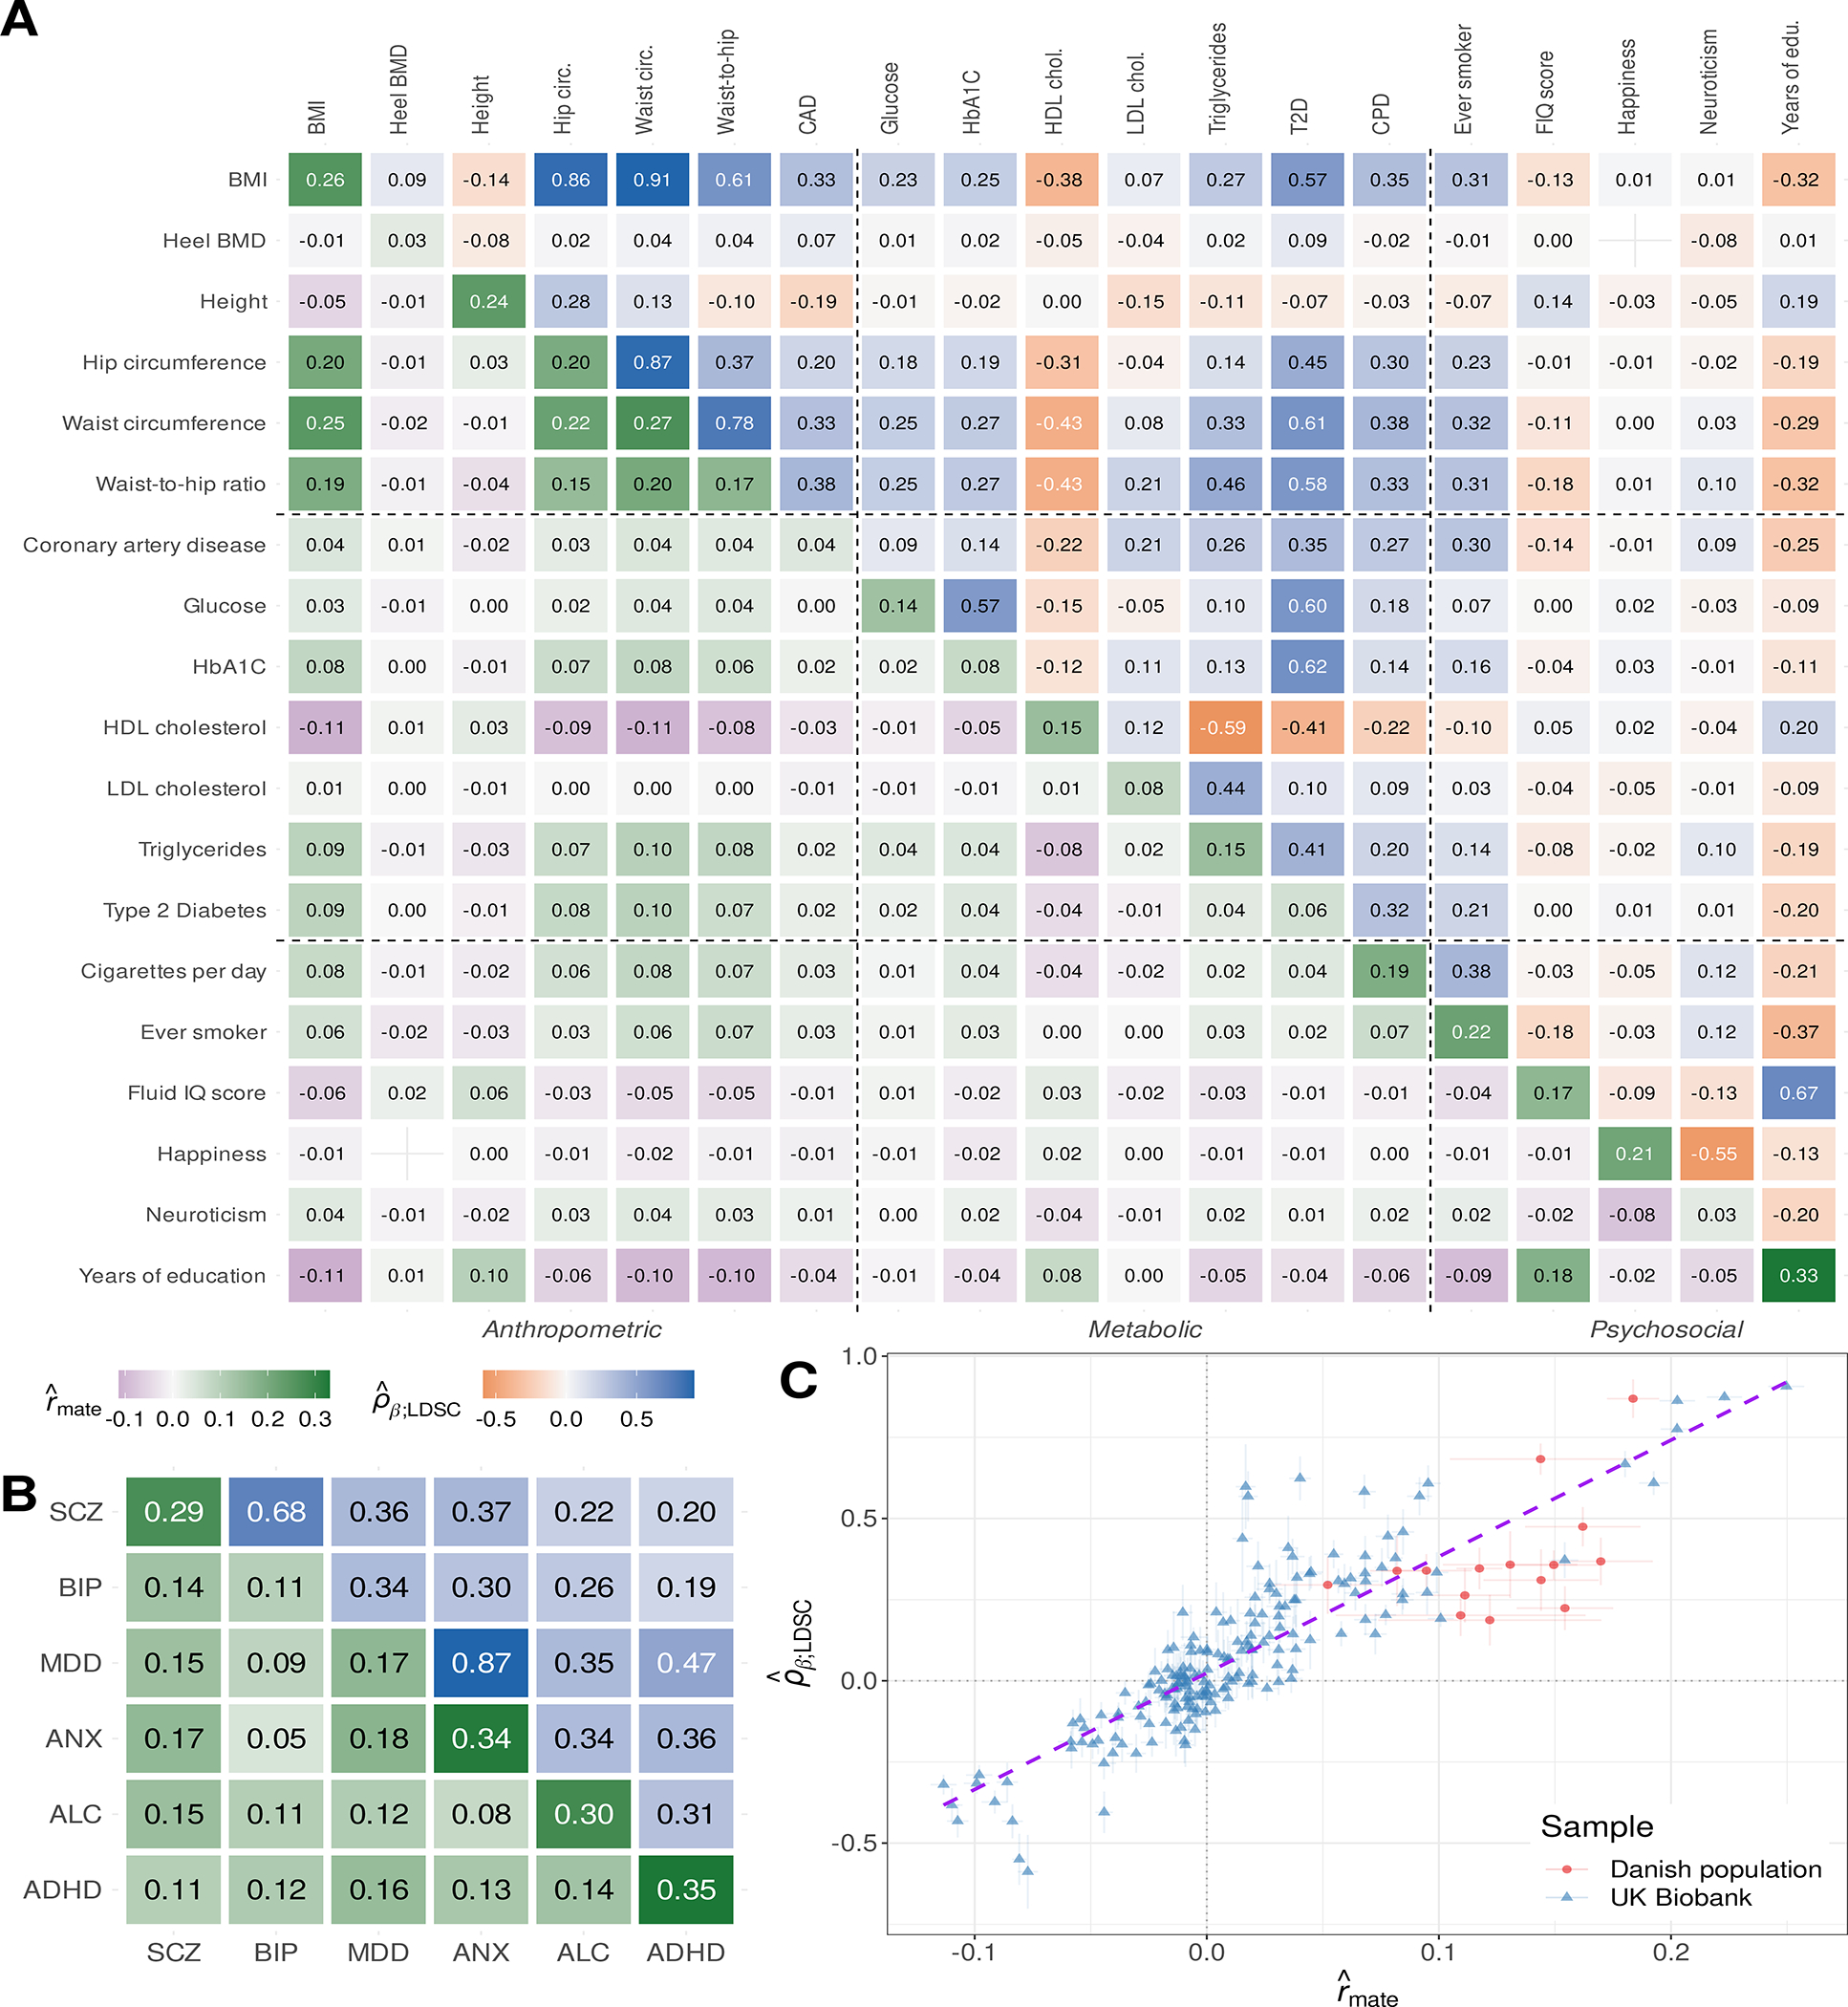
Fig. 1. Cross-mate phenotypic correlation and genetic correlation estimates.

(A) Correlations among previously-studied UK Biobank (UKB) phenotypes. Diagonal and sub-diagonal heatmap entries correspond to cross-mate phenotype correlation estimates derived from 40,697 putative spouse pairs in the UKB. Super-diagonal entries correspond to empirical LD score regression (LDSC) correlation estimates among unrelated European ancestry UKB participants. (B) Cross-mate correlation and genetic correlation estimates for psychiatric disorders. Diagonal and sub-diagonal entries reflect cross-mate tetrachoric correlations among 373,283 spousal pairs sampled from the Danish population, all of which were significantly greater than zero (maximum p=1.69e-5). Super-diagonal entries are previously-reported LDSC correlation estimates (23). (C) Association between empirical cross-mate phenotypic correlation and genetic correlation estimates (meta-analytic R2 ≈ 74%). Error lines indicate 95% confidence intervals and the purple dashed line displays the line of best fit across all points. All numbers have been rounded to two decimal places. The model for bone mineral density (BMD) and subjective happiness failed to converge and is omitted. ADHD: attention-deficit hyperactivity disorder; ALC: alcohol use disorders; ANX: anxiety disorders; BIP: bipolar disorders; BMI: body mass index; HDL/LDL: high/low-density lipoprotein; IQ: intelligence quotient; MDD: major depressive disorder; SCZ: schizophrenia.
