
Fig. 3. Empirical and expected genetic correlations among UK Biobank phenotypes.
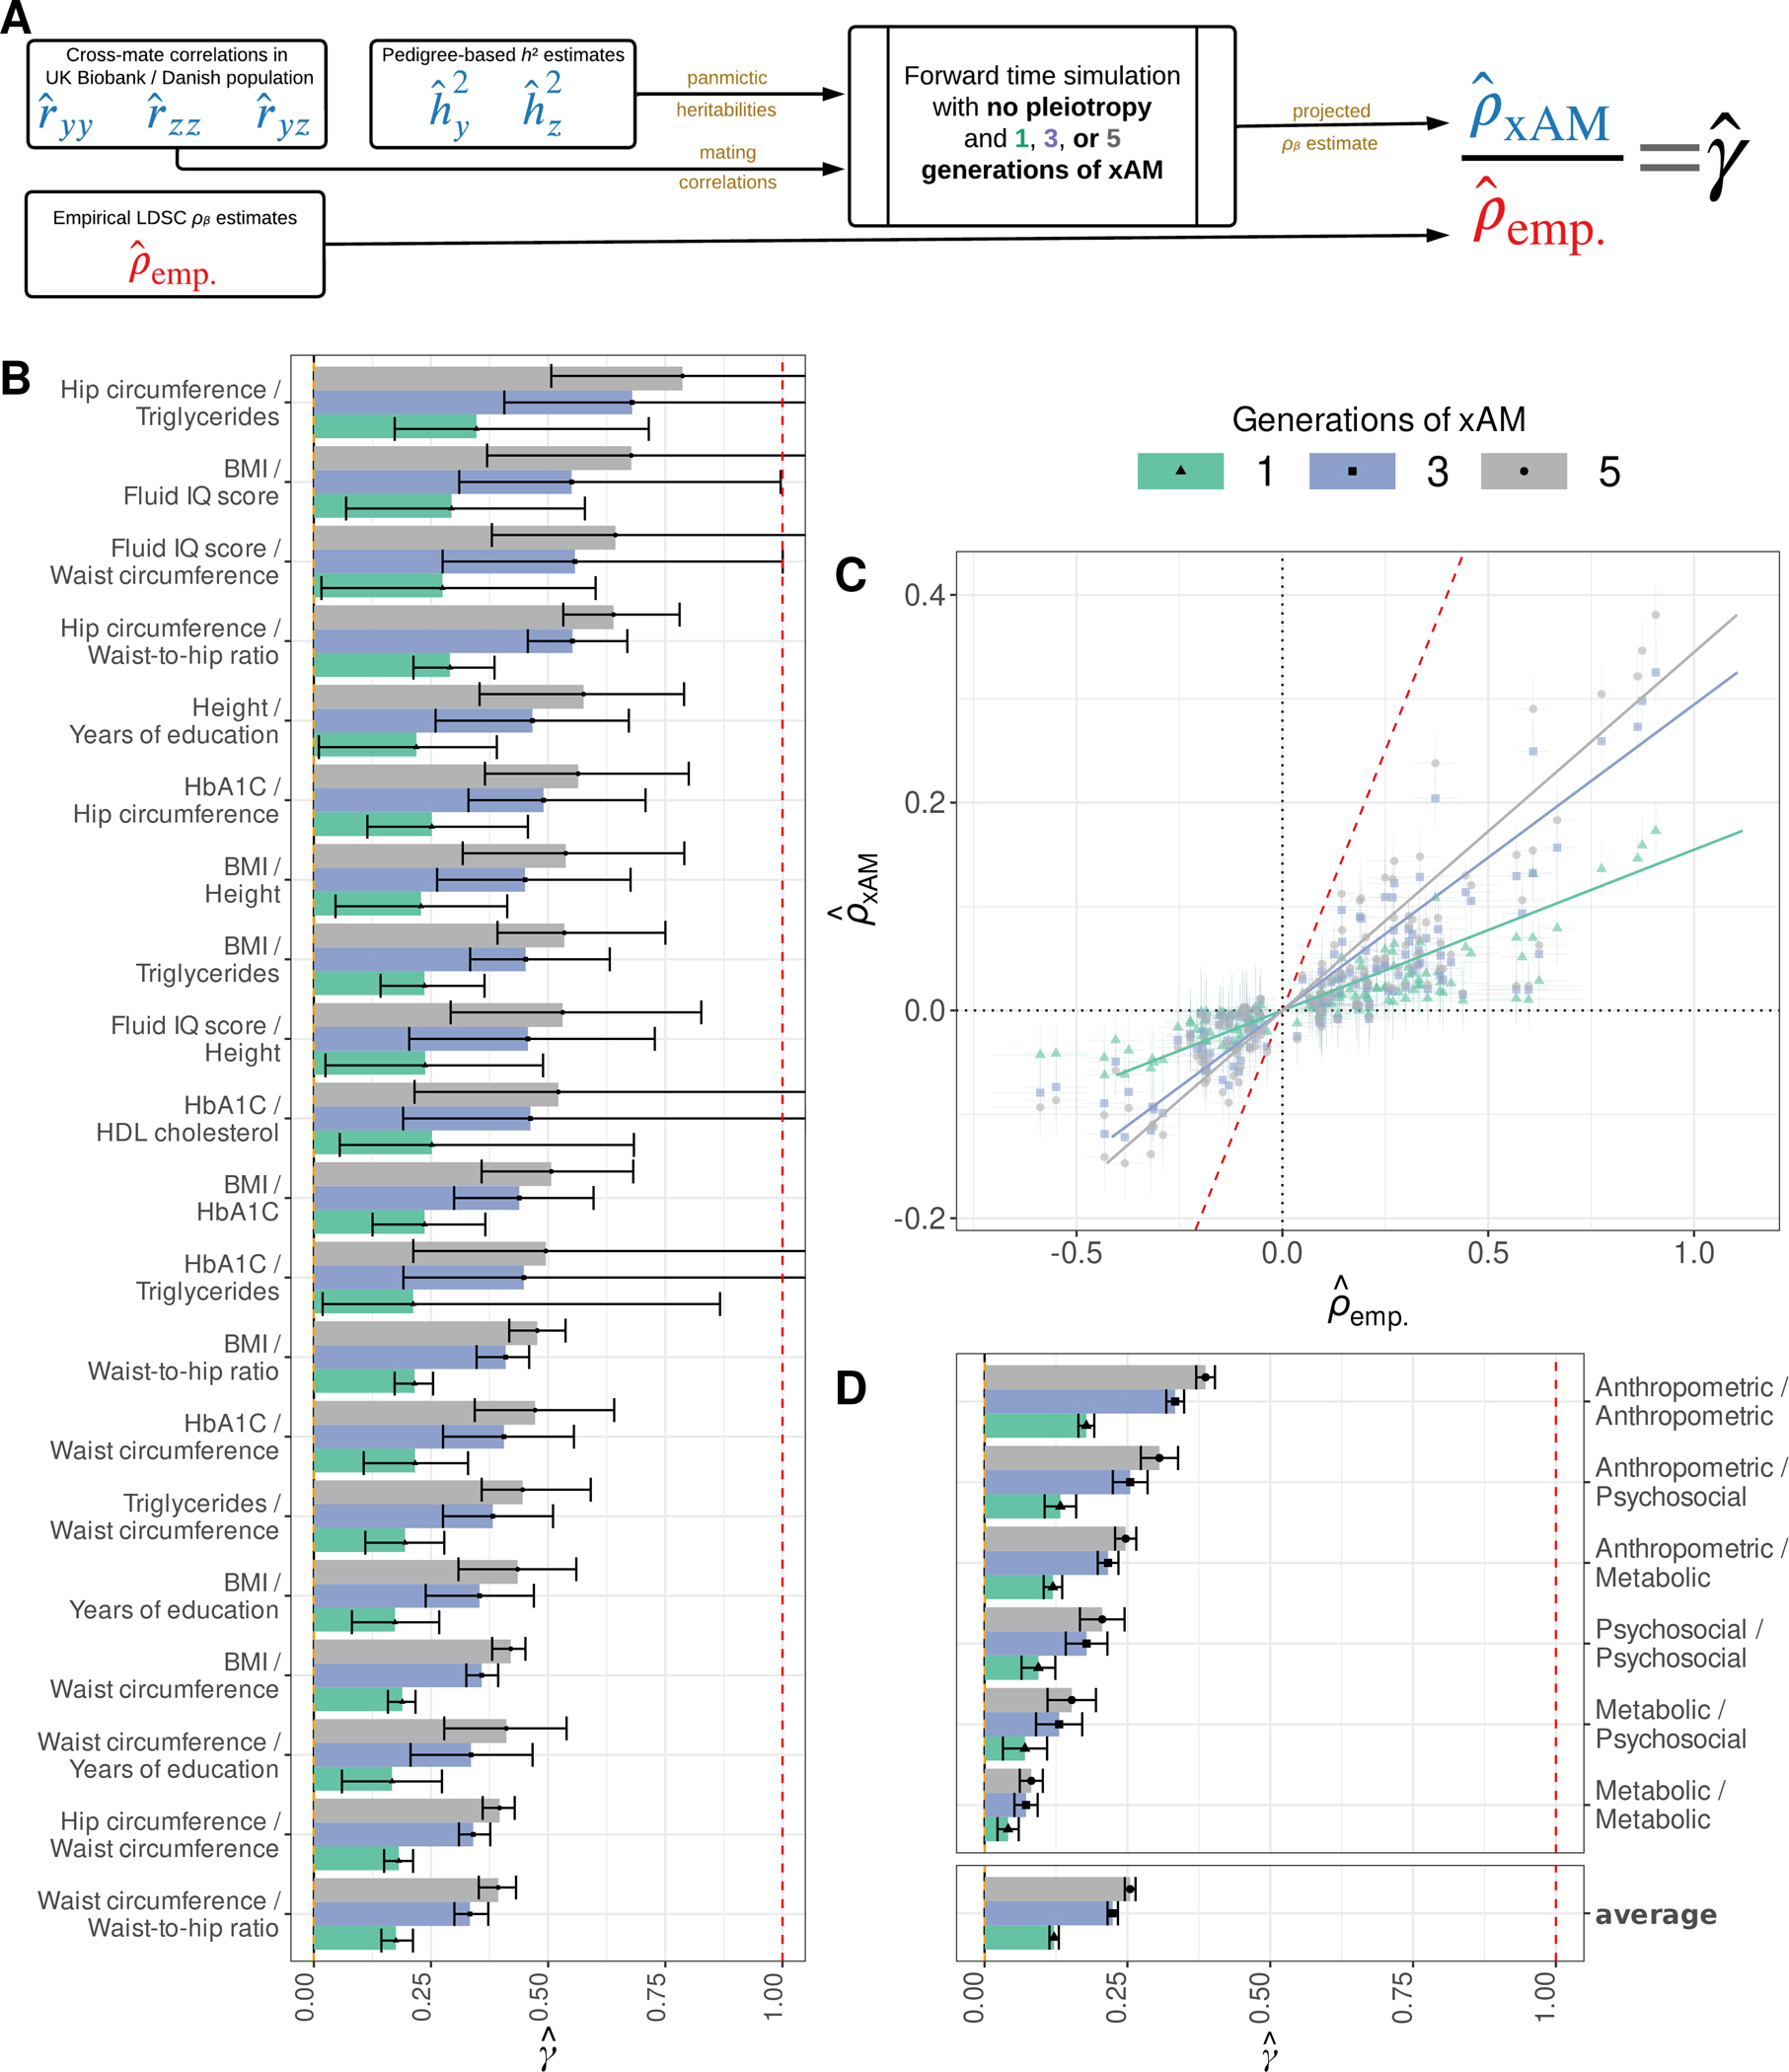
(A) We computed the expected LD score regression (LDSC) genetic correlation estimate in the absence of pleiotropy and after a given number of generations of xAM , which we compared to empirical LDSC estimates to obtain the ratio . (B) The top 20 estimates across previously-studied UKB phenotype pairs with nominally significant (p < 0.05) values. (C) Projected versus empirical LDSC estimates for all UKB phenotypes with nominally significant genetic correlation estimates. (D) Inverse variance weighted average estimates within and between qualitatively similar phenotypic domains. Error bars throughout represent 95% credible intervals.