
Fig. 5. Genetic level evidence consistent with xAM in the UK Biobank.
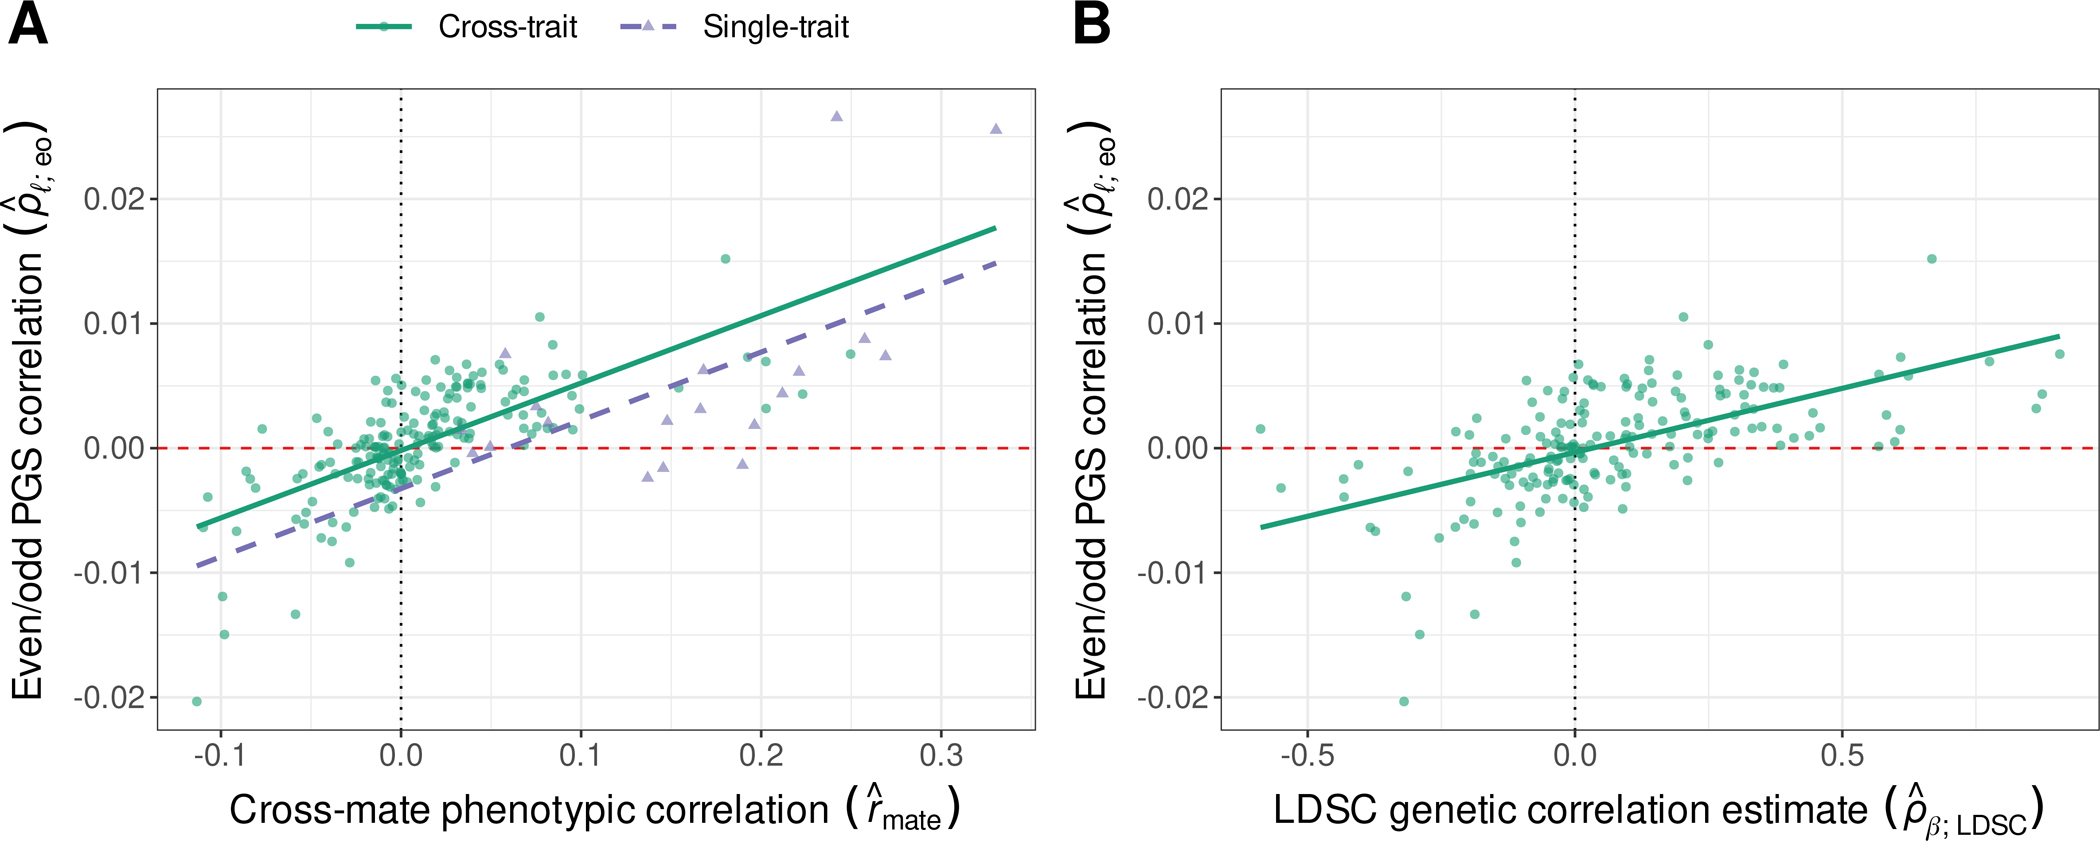
(A) Correlation between even and odd chromosome-specific polygenic scores (PGS) as a function of the cross-mate phenotypic correlation. For a single trait, the vertical axis reflects the correlation between even and odd chromosome scores , and the horizontal axis reflects the cross-mate correlation. For a pair of traits Y, Z, the vertical axis reflects a single parameter to which the correlations between , and between , are both constrained, and the horizontal axis reflects the cross-mate cross-trait correlation. (B) Cross-trait even/odd PGS correlations as a function of empirical LD score regression genetic correlation estimates.