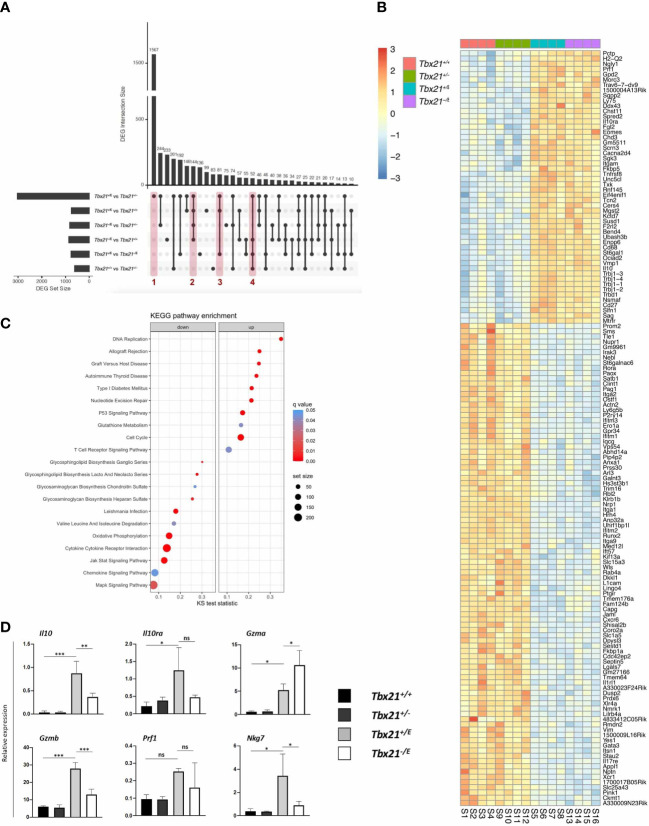
Figure 4.
Transcriptional effects of Eomes in CD4+ T cells. SMARTA CD4+ T cells of the indicated genotypes were transferred into C57BL/6 mice, followed by LCMV infection as shown in Figure 2A . On day 8 after infection splenocytes were sorted, RNA isolated and sequencing performed. (A) Multi-comparison analysis of all genotypes shown in an upset plot. Set size defines the total amount of differentially expressed genes (DEGs) in this comparison. Intersection size defines the DEGs specifically differentially expressed in the comparisons marked by dots and lines. Red columns mark comparisons further analyzed in (B/Suppl.). (B) Heatmap of DEGs marked by column 2 in Figure 4A (Tbx21+/E and Tbx21-/E vs Tbx21+/+ and Tbx21+/- ) focussing on the role of Eomes in SMARTA CD4+ T cells. (C) KEGG pathway enrichment analysis. The x-axis shows the Kolmogorov-Smirnov (KS) test statistic for each pathway, the size of the dots represents the size of each pathway and the colour the statistical significance. (D) qPCR of selected targets (IL-10 pathway and cytotoxicity) to validate RNA-seq data from in vitro stimulated SMARTA CD4+ T cells. Statistical analysis: *=p < 0.05; **=p < 0.01; ***=p < 0.001; ns, not significant; Error bars denote mean + SEM.

