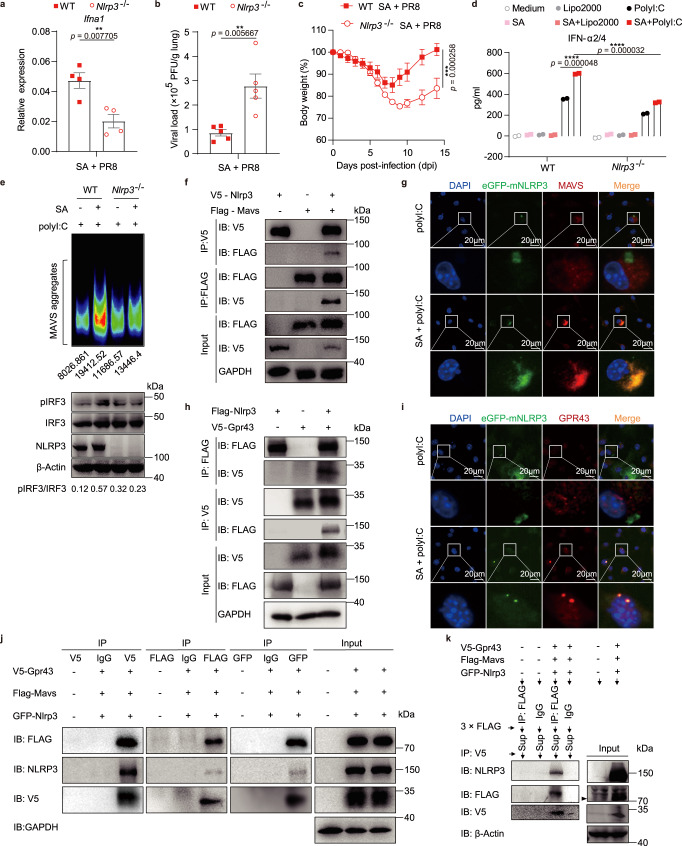
Fig. 7. NLRP3 participates in acetate-promoted IFN-I production via aiding MAVS aggregation.
a–c WT and Nlrp3−/− mice were given 50 mM SA in drinking water and then intranasally infected with PR8 as depicted in Fig. 3c: relative Ifna1 expression to Gapdh (n = 4, n = 4) (a) and viral load in lung homogenates (n = 5, n = 5) (b) on day 7 post-infection and weight loss (n = 10, n = 12) (c) were assessed. d–e WT and Nlrp3−/− BMDMs were pretreated with 250 μM SA for 24 h and then transfected with 200 ng polyI:C for 12 h (d) (n = 2) or 1 h (e). d Concentrations of IFN-α2/4 released from BMDMs. e Crude mitochondria extracts were subjected to SDD-AGE and immunoblotted with anti-MAVS antibody, and the intensity of MAVS aggregation was analyzed with ImageJ v2.0 and marked below. The cell lysates were subjected to immunoblot analysis. The relative ratios of pIRF3 (Ser396) to total IRF3 were analyzed with ImageJ v2.0 and marked below. f, h, j Western blot analysis of co-immunoprecipitation of NLRP3 with MAVS or GPR43 from cell lysates of HEK293T cells transfected with plasmids expressing V5-tagged NLRP3 and FLAG-tagged MAVS (f) or FLAG-tagged NLRP3 and V5-tagged GPR43 (h) or V5-tagged GPR43, eGFP-tagged NLRP3 and FLAG-tagged MAVS (j). g, i PRP-eGFP-mNlrp3-retrovirus infected BMDMs were pretreated with 250 μM SA for 24 h and then transfected with 200 ng polyI:C for 1 h. Fluorescence images of eGFP-mNLRP3 (green), MAVS (red) or GPR43 (red) and cell nuclei (blue) were captured with confocal microscope. k Western blot analysis of sequential IP in overexpressing systems. The mutual interaction among NLRP3, MAVS and GPR43 were confirmed. The black arrow indicates the specific FLAG-MAVS band. Results represent two (a–c, g, i, k) or three independent experiments (d–f, j). Data in (a–d) are presented as mean (± SEM), two-tailed Student’s t test (a–c), one-way ANOVA with Dunnett’s post-hoc test (d). Significant values are defined by *p < 0.05, **p < 0.01, ***p < 0.001, ****p < 0.0001. Source data are provided as a Source Data file.

