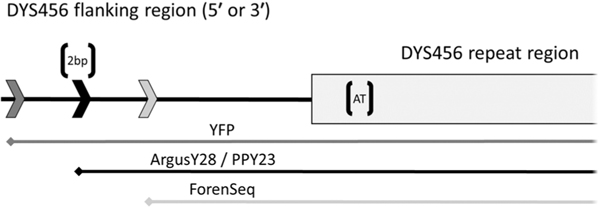
Fig. 3.
Schematic representation of a (5′ or 3′) flanking region of DYS456 is on the top of the graph. The gray box on the right is the DYS456 repeat region and the attached black line represents the flanking region. The three arrows on the left represent possible primer placements, and the three lines below represent the amplicons of the four kits. These approximate positions are inferred from the allele calls observed from the four commercial kits (Table 4.), suggesting the location of indels ‘[]’ in this sample pair. The ‘[AT]’ represents a sequenced indel inside the repeat region, while the ‘[2 bp]’ represents an expected 2 bp deletion amplified by YFP but not ForenSeq (resulting in 16 and 16.2 allele calls, respectively), and at the primer binding site of ArgusY28 and PPY23 (resulting in null alleles).

