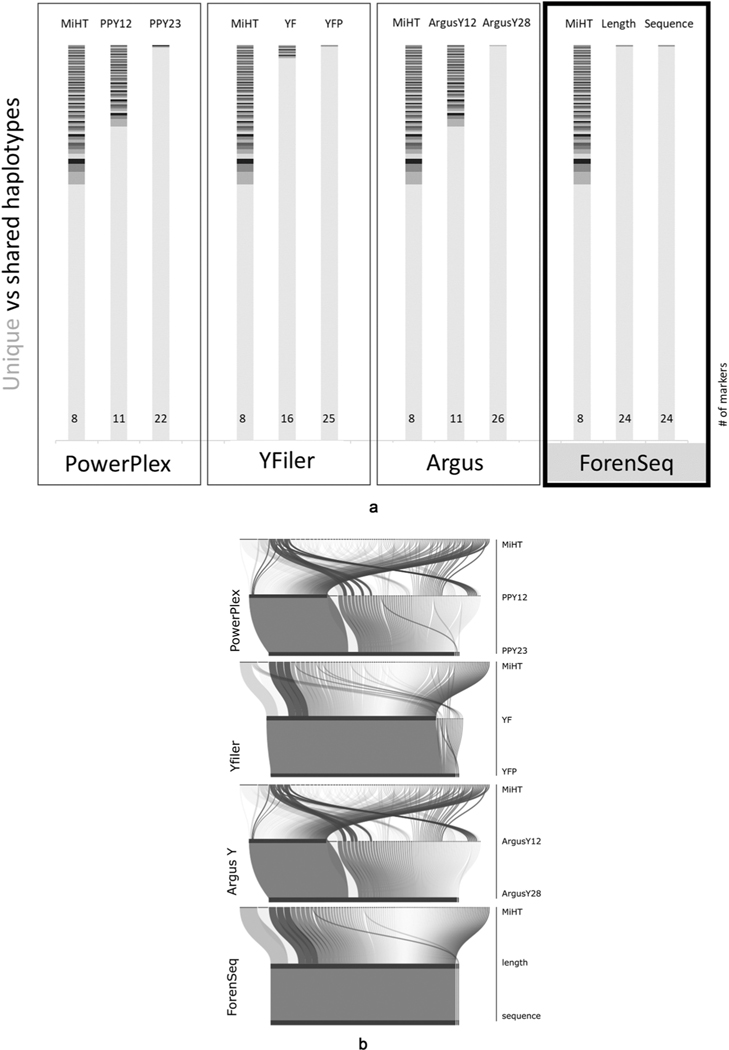
Fig. 4.
Resolution of haplotypes of the ‘NIST 1032’ sample set through the evolution of commercial kits. Fig. 4a. shows the histograms of haplotypes for four different series of Y-STR kits, starting with MiHT for each series with progression through the earlier to current kit versions. In each histogram unique haplotypes in the set are shown in light grey, and shared haplotypes across samples are colored darker. Number of markers for each set are noted at the bottom of each histogram. The first three boxes of the figure show data for the CE kits, while the last box (with black border) depicts the haplotypes described by the ForenSeq marker set, based on derived length alleles in the middle and sequenced alleles on the right. Maximum haplotype resolution would show a single light grey bar, which was not achieved for this sample set by any of these kits. Fig. 4b. is an alluvial graph representing the break-down (bended connector lines) of the shared haplotypes of the MiHT (excluding the n = 668 haplotypes which were unique by the MiHT) by marker sets of commercial CE kits in three stages: starting from the shared haplotypes of the MiHT, followed by early versions of the kits, and the current commercial versions at the third horizontal line for each series/manufacturer. Below the three CE-based kits is the ForenSeq kit, starting from haplotypes of MiHT, then change via length to sequence-based haplotypes. The thickness of the connectors represents the number of samples within the shared haplotypes. The horizontal black bars represent unique haplotypes and remaining unresolved haplotype pairs in the current kits. Maximum haplotype resolution would show a single horizontal black bar, which was not achieved by any of these kits, leaving one to three unresolved pairs for this sample set.

