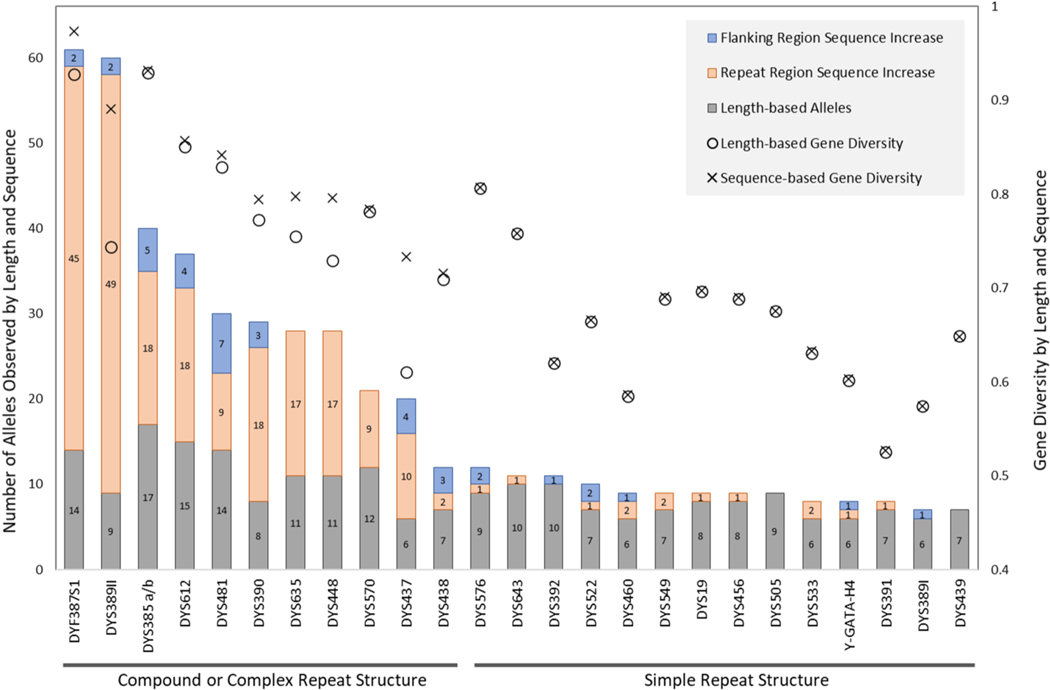
Fig. 5.
Allele counts and gene diversity values for both length-based and sequence-based alleles for 25 Y-STRs in the ForenSeq kit (UAS 24 plus the unreported DYS456) for the ‘NIST 1032’ set. The ‘x’ axis lists the Y-STRs, the left ‘y’ axis is the number of alleles, and the right ‘y’ axis is the gene diversity. For each locus, the bars of the histogram consist of up to three sections: grey = number of length-based alleles, orange = number of new alleles resulting from repeat region sequence variations and blue = additional new alleles from flanking region variants. The number inside of each section indicates the count of unique alleles. Gene diversity values are plotted for length- (◯) and sequence-based alleles (×). Gene diversity values for the two multi-copy loci (DYF387S1 and DYS385 a/b) are calculated based on locus-specific haplotype frequencies.

