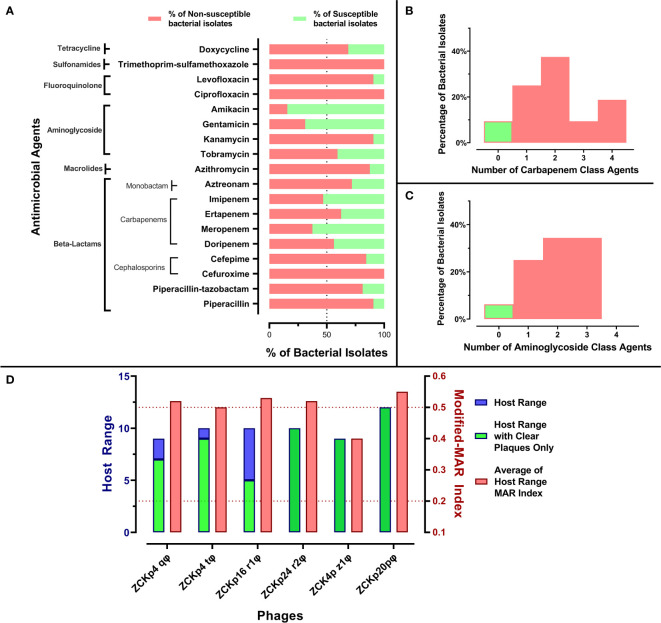
Figure 1.
Antibiogram of bacterial isolates and phage host range. (A) A stacked-bar chart of bacterial isolates’ resistance and susceptibility percentages to each tested antimicrobial agent. The susceptibility test was carried out by the disk diffusion method, and the results were interpreted according to CLSI 2019. (B) A histogram representing the percentage of bacterial isolates not susceptible to one or more carbapenem antibiotic. (C) A histogram representing the distribution of bacterial isolates not susceptible to one or more aminoglycoside. (D) Host ranges of the six isolated phages and average modified-MAR indices of their bacterial hosts. Blue bars represent the number of bacterial isolates in the host range of each isolated phage, while the green bars specify only the number of hosts that showed clear plaques. The left Y-axis describes blue and green bars. Red bars show the average modified-MAR indices of all isolates included in each isolated phage host range. The scale for red bars is plotted on the right Y-axis.

