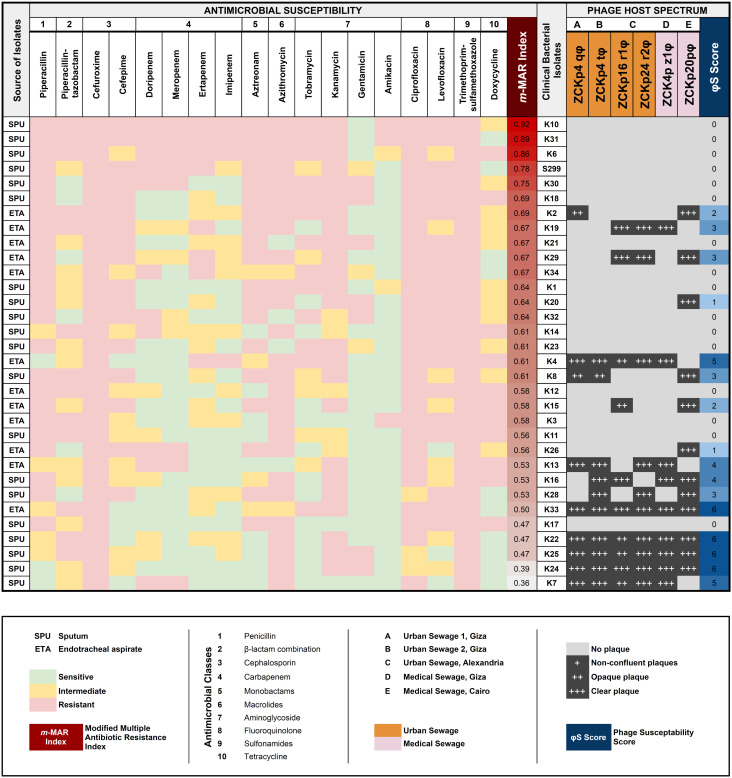
Figure 2.
Antimicrobial and phage susceptibility profile of bacterial isolates. A heatmap of the antimicrobial profile of each bacterial isolate against 18 antimicrobial agents of 10 classes, with the estimated modified-MAR index for all isolates. The sources of isolated bacteria (SPU = sputum; ETA = endotracheal aspirate) are indicated in the leftmost column. In a grayscale matrix, the host range of each of the isolated phages is presented according to the plaque clarity (non-confluent plaque [+] to clear plaque [+++]) against the bacterial isolates. The host range of each phage is given a score (represented as a blue shaded gradient) that reflects the number of susceptible host isolates. The isolated phages are color-coded according to their source of isolation. A partial negative correlation is observed between the bacterial resistance of an isolate and its susceptibility to phage infection (Spearman rank correlation coefficient rs = - 0.6139, P = 0.00019).

