Figure 4.
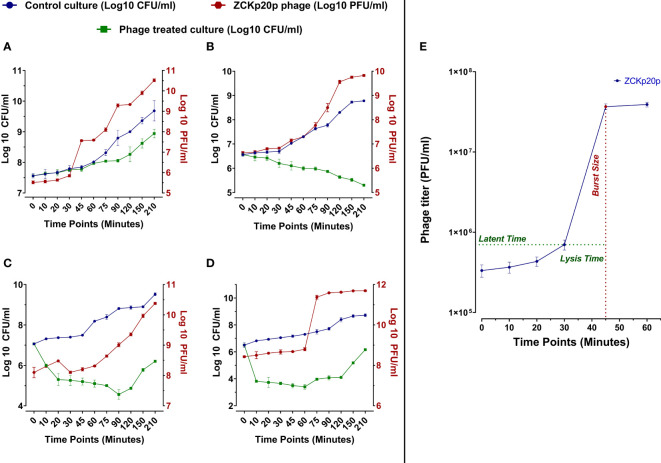
In vitro bacteriolytic dynamics of phage vB_Kpn_ZCKp20p at different MOIs (0.1, 1, 10, and 100) and one-step growth curve. MOIs are separately represented in the above charts (A–D, respectively). Blue and green lines are plotted against the left Y-axis, representing the mean bacterial count of the control culture (untreated) and the survived bacteria of phage treated culture, respectively. The red line represents the mean of phage titers determined by spot test (Carlson, 2005). The mean of phage titers is plotted against the right Y-axis. The results were plotted as the mean of triplicates with error bars of ± SD. (E) One-step growth curve of phage vB_Kpn_ZCKp20p at MOI 0.1. Results are mean values ± SD of phage titer (PFU/ml). The phage titer (blue line) was determined at an interval of 10 to 15 min post-infection, and titers were determined by spot test (Carlson, 2005)—the latent period of about 30 min and the lysis time (∼15 min) during which the bacterial cells start to burst till they reach a maximum and form a plateau of released PFU. The burst size (red) was estimated at 100 PFU/cell ( ± 10).

