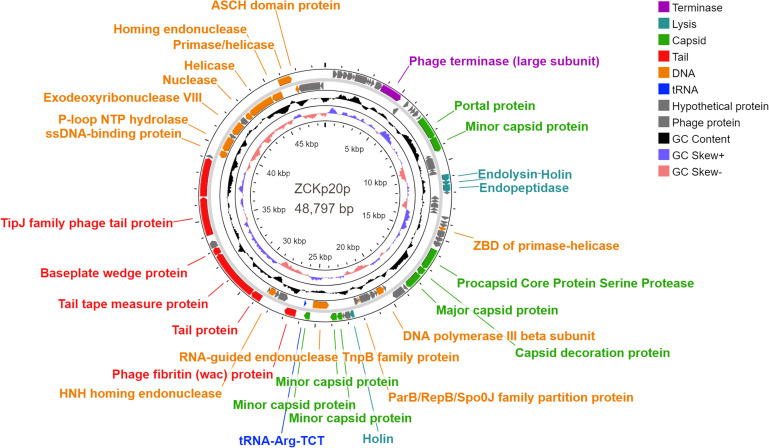
Figure 8.
Genomic circular map of phage vB_Kpn_ZCKp20p. Different colors represent the coding sequences (CDS) according to the category of the predicted function: terminase (violet); lytic enzymes (turquoise); capsid proteins (green); tail proteins (red); DNA metabolism, replication and repair-related proteins (orange); tRNA gene (blue); phage and hypothetical proteins (grey). The GC content skew is represented in the middle circle with black color. The inner circle represents the GC skew in light blue and light red colors for above and below averages, respectively.

