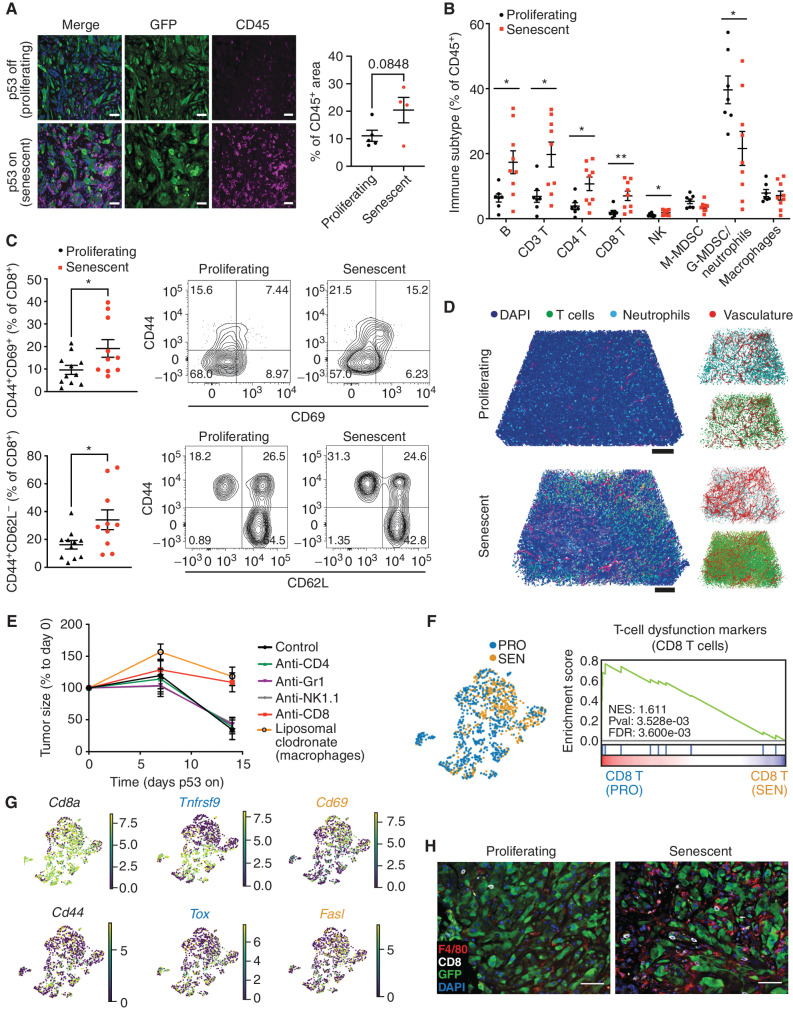
Figure 2.
Senescence triggers an immune evasion-to-immune recognition tumor switch. A, Representative images of CD45 and GFP staining marking immune cells and tumor cells, respectively, in p53-suppressed and p53-restored tumor (7 days after p53 restoration). Right, the quantification of the area of CD45+ staining calculated from 3 random fields per mouse. Each dot represents a mouse. B, Flow cytometry analysis of the global immune landscape in an orthotopic NSP liver tumor model. Immunophenotyping of senescent tumors is performed 9 days after Dox withdrawal, a time point when the senescent state is fully established, yet preceding the massive tumor regression. G-MDSC, granulocytic myeloid-derived suppressor cells; M-MDSC, monocytic myeloid-derived suppressor cells. Data are pooled from 2 independent experiments, with n = 7 in the proliferating group and n = 9 in the senescent group. Note that, as the absolute number of CD45+ cells increases in senescent NSP tumor lesions (A), so do the total numbers of the indicated cell types. C, Flow cytometry analysis of CD8 T cells. Data are pooled from 2 independent experiments, with n = 11 in the proliferating and n = 10 in the senescent groups. Experiments were performed 9 days after Dox withdrawal. D, Representative tissue clearing images of the orthotopic NSP liver tumors. T cells, neutrophils, and vasculature are labeled by CD3, MPO, and CD31 staining, respectively. Samples were collected 9 days after Dox withdrawal. E, Tumor size change measured by ultrasound upon p53 restoration in mice after depleting specific immune cell types using antibodies or drugs. F, Left, uniform manifold approximation and projection (UMAP) plot of CD8 T cells isolated from p53-suppressed proliferating (PRO) and p53-reactivated senescent (SEN) tumors. Right, gene set enrichment analysis of T-cell exhaustion marker genes in CD8+ T cells from proliferating (p53-suppressed) versus senescent (p53-reactivated) tumors. NES, normalized enrichment score; Pval, P value. G, UMAP plot of the expression of selected genes (Cd8a, Cd44, Tnfrsf9, Cd69, Tox, and Fasl) between CD8 T cells isolated from senescent (p53-reactivated) and proliferating (p53-suppressed) tumors. H, Representative immunofluorescence images of CD8 T cells and F4/80-positive macrophage staining in the orthotopic NSP liver tumor. Tumor samples were collected 9 days after Dox withdrawal. Data are presented as mean ± SEM. All scale bars, 100 μm. A two-tailed Student t test was used. *, P < 0.05; **, P < 0.01.

