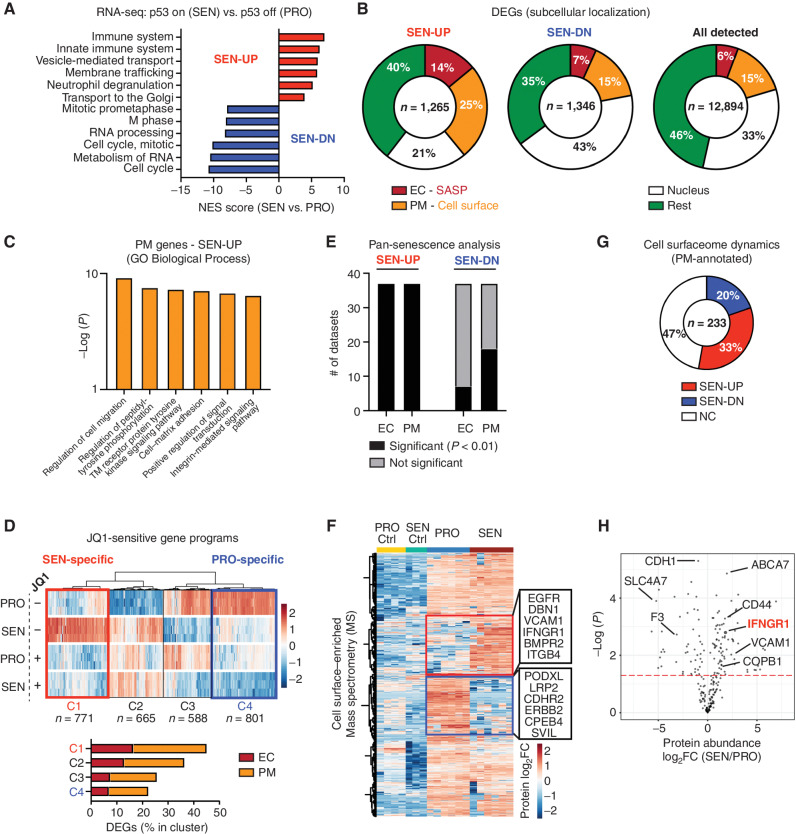
Figure 3.
Senescence remodels tissue-sensing programs and cell-surfaceome landscape. A, Gene set enrichment analysis (Reactome) of RNA-seq data from proliferating (PRO, p53 off) versus senescent (SEN, p53 on for 8 days) NSP liver tumor cells in vitro. NES, normalized enrichment score. B, Subcellular localization of DEGs (P < 0.05; fold change > 2) in all detected genes [transcripts per kilobase million (TPM) > 1] from RNA-seq. C, Gene ontology (GO) analysis of DEGs encoding PM proteins upregulated in senescent cells. TM, transmembrane. D, Transcriptomic analysis of all DEGs (proliferating vs. senescent) in the presence or absence of JQ1 treatment. The C1 cluster (in red) contains the senescence-specific genes sensitive to JQ1, and the C4 cluster (in blue) contains the proliferation-specific genes sensitive to JQ1. E, Meta-analysis of RNA-seq dataset from SENESCopedia by performing subcellular localization of DEGs (same as Fig. 2D) and Fisher exact test to examine the relative enrichment of upregulated and downregulated EC/PM-DEGs deviated from the random distribution. See also Supplementary Fig. S7E and S7F. F, Mass spectrometry (MS) analysis of PM-enriched proteome in proliferating and senescent cells. Protein level is normalized to mean expression of the protein of all samples. Controls are the samples without biotin labeling serving as background. Red and blue boxes represent proteins enriched in senescent and proliferating cells, respectively. n = 6 for both the senescent and proliferating experimental groups, and n = 3 and 4, respectively, for their control. G, Distribution of upregulated and downregulated GeneCards-annotated PM proteins profiled by MS. NC, no change. H, Volcano plot of GeneCards-annotated PM proteins profiled by MS.

