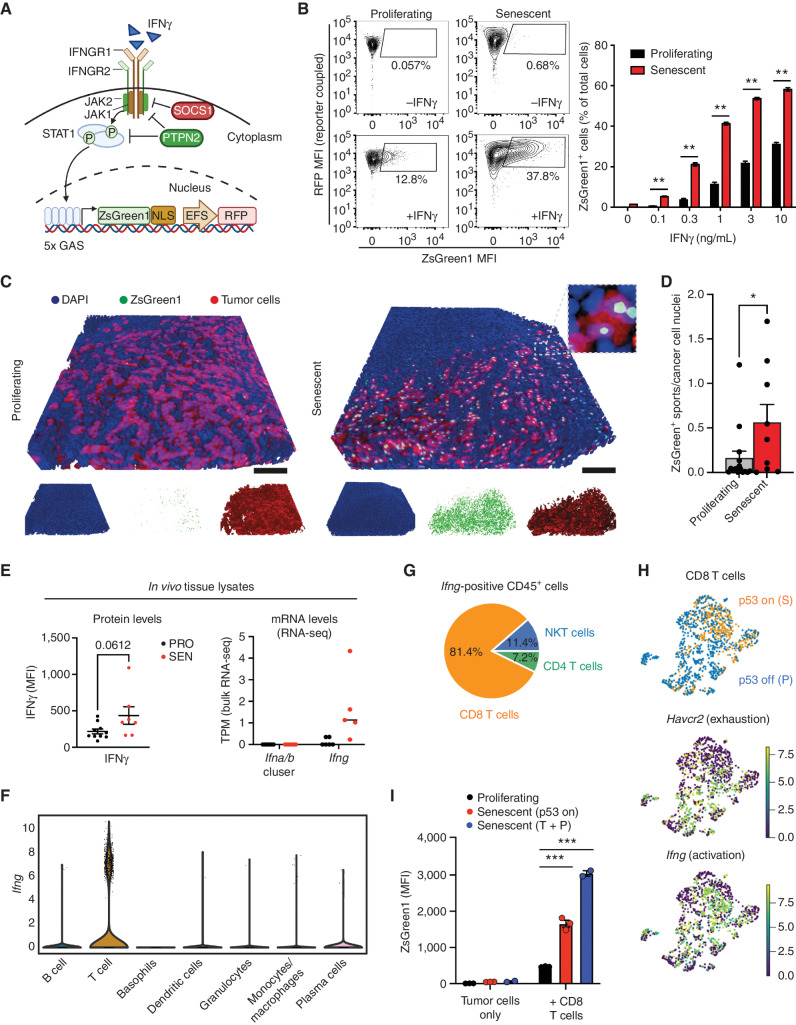
Figure 6.
Senescence enhances IFNγ-mediated heterotypic signaling from activated immune cells to tumor cells. A, Graphic illustration of the IGS reporter. (Created with BioRender.com.) B, Left, representative flow cytometry plots measuring ZsGreen1 signals in proliferating and senescent NSP cells treated with 1 ng/mL IFNγ. Right, quantification of the percentage of ZsGreen1-positive cells upon IFNγ treatment. MFI, median fluorescence intensity. C and D, Representative 3D imaging of tissue-cleared tumors from the orthotopically injected liver NSP cell line expressing IGS reporter (C). Quantification of 3 randomly selected fields from the liver tumor of each mouse (D). n = 5 and n = 3 for the proliferating and senescent groups (9 days after p53 restoration), respectively. Scale bars, 100 μm. E, Top, cytometric bead array assay for the IFNγ level from in vivo tumor tissue lysate samples (7 days after p53 restoration). Bottom, transcripts of indicated genes from RNA-seq of in vivo bulk samples of tumors generated by HTVI (PRO, p53 off; SEN, p53 restoration for 12 days). TPM, transcripts per kilobase million. Noted Ifna/b cluster contains 14 Ifna subtypes and 1 Ifnb gene. F and G, Expression of Ifng in tumor-infiltrating immune cells profiled by scRNA-seq in the NSP transplantable model (as in Fig. 2, sample collected at day 8 after p53 restoration). H, Uniform manifold approximation and projection plot of the expression of Havcr2 (encoding TIM3) and Ifng in CD8 T cells harvested from proliferating (P) and senescent (S) tumor lesion. Top panel is replicated from Fig. 2F (left) to indicate cells corresponding to each condition. I, Quantification of ZsGreen1 intensity of NSP tumor cells in the OT-I T-cell and SIINFEKL-expressing tumor cell coculture experiment (effector-to-target ratio, 5:1) after 20 hours of coculture. Signal measured by flow cytometry. T + P, trametinib plus palbociclib. See experimental details in Supplementary Fig. S12E. Data are presented as mean ± SEM. Two-tailed Student t test was used. *, P < 0.05; **, P < 0.01; ***, P < 0.001.

