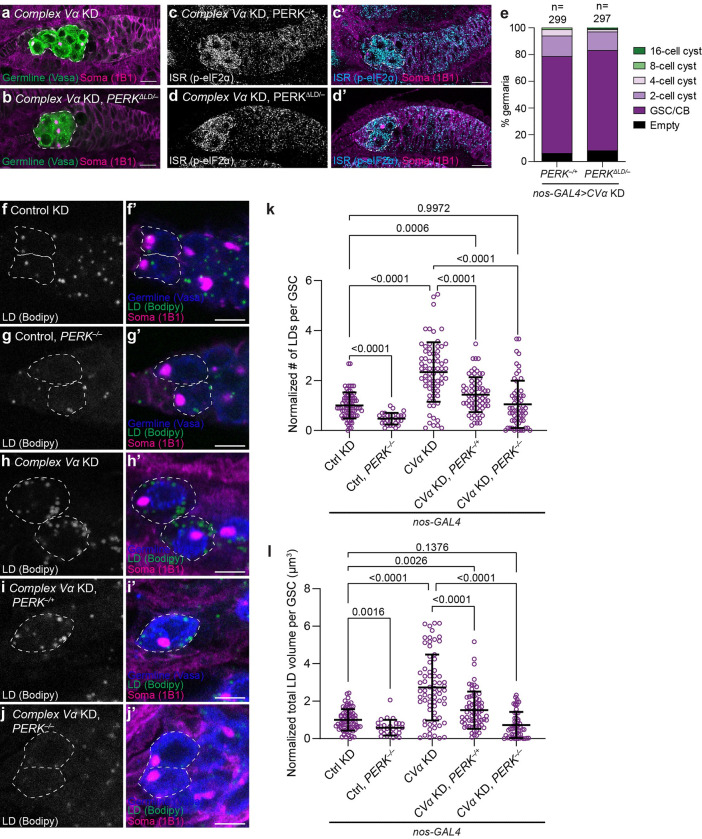
Fig 5. Complex V knockdown induces endoplasmic reticulum lipid bilayer stress.
(a-d) Representative images of 1-day old CVα KD, PERK–/+ (a, c) and CVα KD, PERKΔLD/–(b, d) germaria. GSCs are outlined in white-dashed lines. (e) Quantification of germline differentiation stage in germaria of indicated genotypes. Number of germaria scored above each bar. (f-j) Representative images of 2–3 day old Control (mCherry) KD (f), PERK–/–(g), CVα KD (h), CVα KD, PERK–/+ (i) and CVα KD, PERK–/–(j) GSCs (white-dashed line). BODIPY 493/503 marks lipid droplets. (k) Quantification of number of lipid droplets per GSC normalized to mean of Control for the indicated genotypes (n = 75 for Ctrl (mCherry) KD; n = 28 for Ctrl, PERK–/–; n = 71 for CVα KD; n = 68 for CVα KD, PERK–/+; and n = 59 for CVα KD, PERK–/–). (l) Quantification of total lipid droplet volume per GSC normalized to the mean of the Control for the indicated genotypes (n = 73 for Ctrl (mCherry) KD; n = 28 for Ctrl, PERK–/–; n = 72 for CVα KD; n = 68 for CVα KD, PERK–/+; and n = 55 for CVα KD, PERK–/–). All RNAis were driven by nos-GAL4. Scale bars represent 10 μm (a-d) and 5 μm (f-j). For all plots, germaria were studied from 10 or more ovaries, obtained in at least three independent experiments and over two or more crosses. For (k, l), data are mean ± s.d. and one-way ANOVA followed by Games-Howell multiple comparison’s test was used for statistical analysis. For exact genotypes see S2 Table.

