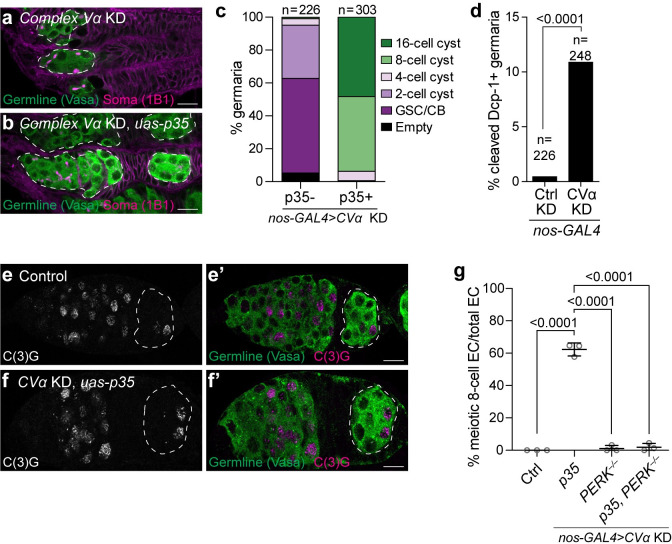
Fig 6. Loss of Complex V induces precocious meiosis and cyst death.
(a, b) Representative images of 1 day old CVα KD (a) and CVα KD, P35 overexpression (b) germaria. White-dashed lines demarks the germline. (c) Phenotypic characterization and quantification of germline differentiation stage in germaria of (a, b). Number of germaria scored above each bar and were studied from 10 or more ovaries, obtained in at least three independent experiments and over two or more crosses. (d) Frequency of cell death positive germaria of 2–3-day old ovaries Control (mCherry) KD and CVα KD immunostained with anti-cleaved Dcp1, which marks cells undergoing apoptosis. Number of ovarioles studied and P-value (Fisher’s exact test) are given above bars. (e, f) Representative images of 1 day old Control (e) and CVα KD, P35 overexpression (f) germaria stained with the synaptonemal complex component C(3)G to mark cells in meiosis. See S12E and S12F Fig for confocal slices highlighting number of nuclei. White-dashed lines demark the Region 3 egg chamber. (g) Frequency of meiotic 8-cell cyst egg chambers (EC) for the indicated genotypes (n = 79 for Control (no GAL4); n = 122 for CVα KD, UAS-P35; n = 120 for CVα KD, PERK–/–; and n = 229 for CVα KD, UAS-P35, PERK–/–). Each data point represents a replicate with 20–90 egg chambers analyzed and plotted as mean ± s.d. An ANOVA followed by Tukey post-hoc test was performed. All RNAi and P35 were driven by nos-GAL4. For all images scale bars represent 10 μm. For exact genotypes see S2 Table.

