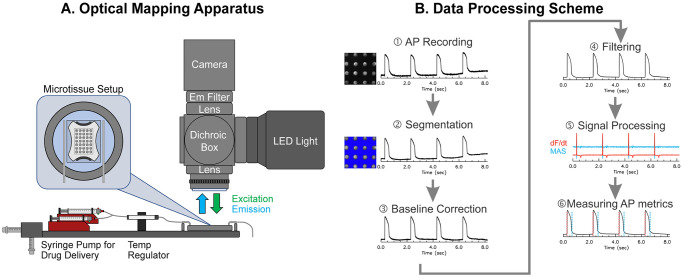
Fig 1. Schematics of fluorescence recording apparatus and data processing.
(A) Optical apparatus to record action potential (AP) from hiPSC-derived cardiac microtissues. (B) Schematic of the data processing pipeline. A series of data processing steps were taken to measure AP metrics: ① AP recording. ② segmentation for identification of individual microtissues, ③ baseline correction to remove fluorescence changes due to dye bleaching or fluctuation of perfusion solution, ④ filtering to increase signal-to-noise ratio while preserving sharpness of AP upstroke, ⑤ calculation of first derivative and moving average subtraction to detect AP upstroke and repolarization, and ⑥ AP metric measurement.

