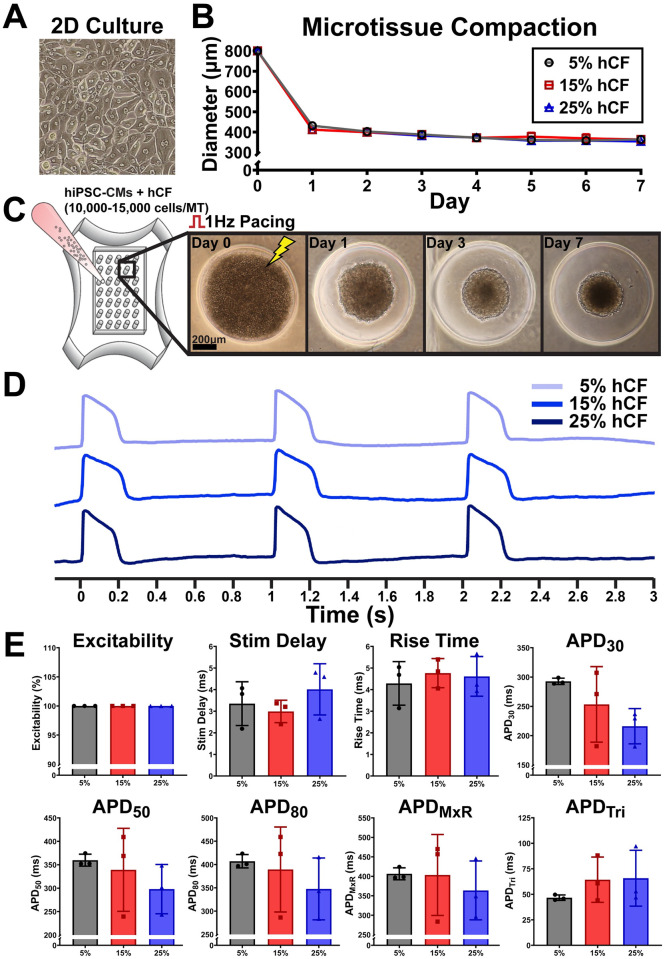
Fig 3. Effects of human cardiac fibroblast (hCF) percentage on microtissue compaction and characterization of AP.
(A) Phase-contrast image of 2D culture of purified hiPSC-CMs for microtissue generation. (B) Microtissue compaction assessed by reduction in spheroidal microtissue diameter over 7 days of culture. (C) Sample images illustrating microtissue compaction over indicated time. (D) Sample action potential traces with indicated hCF content. (E) AP characteristics of microtissues with indicated hCF content recorded after 6–8 days in culture. Each dot represents averaged AP metrics from each mold (n = 3 molds, 32–35 microtissues per mold).

