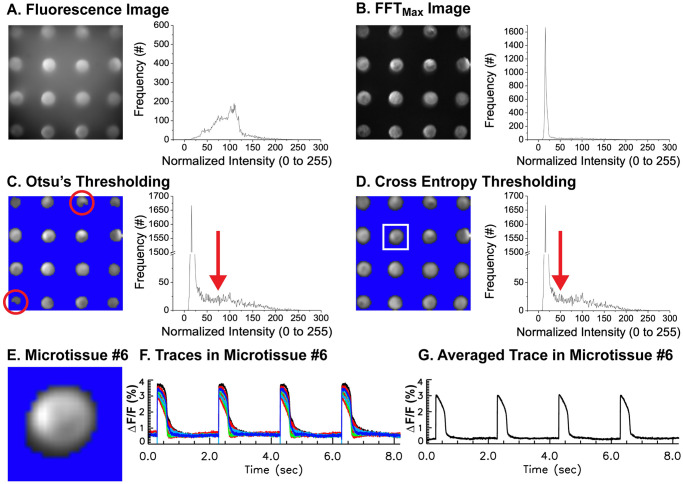
Fig 4. Segmentation of individual microtissues from fluorescence voltage images.
(A) Sample fluorescence image (left) and a histogram of the sample image (right). Traces from each pixel were transformed to frequency domain using FFT, and the maximum FFT amplitude within pacing cycle length were calculated to reconstruct a FFTmax image. (B) FFTmax image that highlights regions showing full AP amplitude. The histogram of FFTmax image (right panel) shows the best contrast image compared to fluorescence intensity in panel A. (C) Otsu’s thresholding and corresponding histogram in log scale showed detailed distribution of pixels with lower intensity. Since Otsu’s method selects a more conservative threshold value (red arrow), the segmentation often results in a smaller or distorted selection of microtissues (red circles). (D) Cross entropy thresholding via a minimum cross entropy algorithm improves the selection of pixels with AP signals (see the red arrow, mean threshold using cross entropy = 30 ± 17 vs. Otsu’s method = 72 ± 16, n = 30 microtissues). After segmentation, a region-labeling algorithm identified individual microtissues in a solid circular shape compared to Otsu’s method in panel C (mean area of microtissue detected using cross entropy = 160 ± 31 pixels vs. Otsu’s method = 99 ± 11 pixels, n = 30 microtissues). (E) Sample selected microtissue marked with a white box in panel D. (F) Superimposed traces from all the pixels within microtissue #6 in panel E. (G) Averaged trace from all the pixels in panel F.

