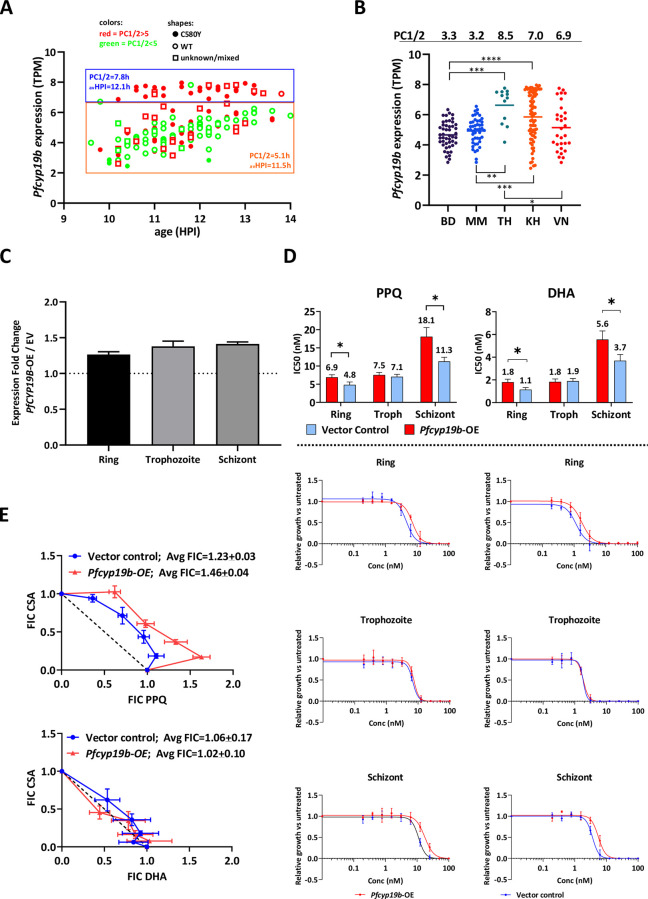
Fig 1. PfCYP19B upregulation plays role in modulating antimalarial drug response.
(A) Pfcyp19b RNA-Seq expression values derived from samples collected during the TRACII study at patient’s admission for the treatment (2015–2018) (n = 173) [31]. Expression values (transcripts per million, TPM) were projected against parasites’ age (HPI). The steady increase in the expression of pfcyp19b can be seen with the parasite’s age. Resistant (PC1/2 > 5) and sensitive (PC1/2 < 5) parasites are shown in red and green respectively. Shapes in the scatter plot represent the type of pfk13 mutation in each sample (C580Y mutant–full dots, wild type (WT)–empty circles, unknown mutation type or mixed WT/C580Y populations–empty squares). Two significantly distinct groups of parasites can be observed based on pfcyp19b expression levels; the first group (upper blue rectangle blue) expressing higher levels of pfcyp19b transcripts regardless of parasite’s age, second group (lower orange rectangle) expressing lower levels of pfcyp19b (p = 2.8E-72, unpaired two-tailed t-test). There is also a significant difference in PC1/2 (p = 1.7E-13, unpaired two-tailed t-test) between these two groups as shown in the graph. Parasites within the orange rectangle exhibit lower PC1/2 values and mostly are of wild type pfk13 background (B) Pfcyp19b expression levels by country in TRACII study (BD–Bangladesh, MM- Myanmar, TH–Thailand, KH–Cambodia, VN–Vietnam). Average PC1/2 are indicated above the graphs showing tight positive linear correlation between mean pfcyp19b expression values (per each site) and the mean PC1/2 (PCC = 0.9). Asterixes indicate p-values of significance in pfcyp19b expression between the sites based on Brown-Forsythe ANOVA test (* p < 0.05, ** p < 0.01, *** p < 0.001, **** p < 0.0001) (C) Fold change increase of total PfCYP19B protein expression in 3D7 PfCYP19B-OE strain compared to Empty Vector control in three distinct developmental stages of the parasite as measured by densitometry. Error bars indicate standard deviation (n = 2) (D) IC50 values from piperaquine (PPQ; left) and dihydroartemisinin (DHA; right) drug assays performed on 3D7 Pfcyp19b-OE line compared to empty Vector controls (top panel) and their respective dose-response curves (bottom panel). Assays were performed on 3 distinct developmental stages (i.e. ring at 4 HPI, trophozoite at 20 HPI, and schizont at 35 HPI). The numbers above bars represent the average IC50 values whereas error bars indicate standard deviation of the IC50 from each treatment conducted in 3 independent biological replicates. Asterixes indicate statistical significance (* p < 0.05) based on unpaired, two-tailed heteroscedastic t-test (E) Modified fixed-ratio isobologram graphs showing drug interaction between PPQ and CsA (top) and DHA and CsA (bottom). Average fractional inhibitory concentration values were derived from three independent biological replicates.

