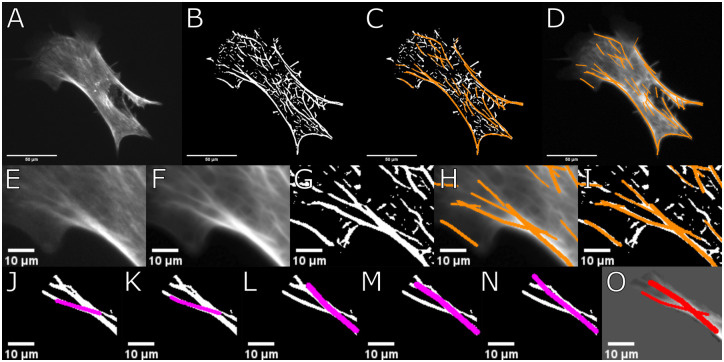
Fig 1. CurveTracer class step-wise illustration.
A: Raw image of example cell. B: Binarized image of example cell. C: Filaments recognized by FS2.0 shown in binarized image. D: Found filaments shown as overlay of raw image. E: Cropped example region of cell shown in A. F: Output of filter routine preparing raw image for filament detection. G: Binarized image of example region. H: Altered image and found filaments overlayed in orange. I: Found filaments in binarized image and overlayed in orange. J-N: Visualised examples of different potential filaments found by curve tracer glass gather function. O: Final filaments found by curve tracer class after correction and weighting of all possible filaments generated.

