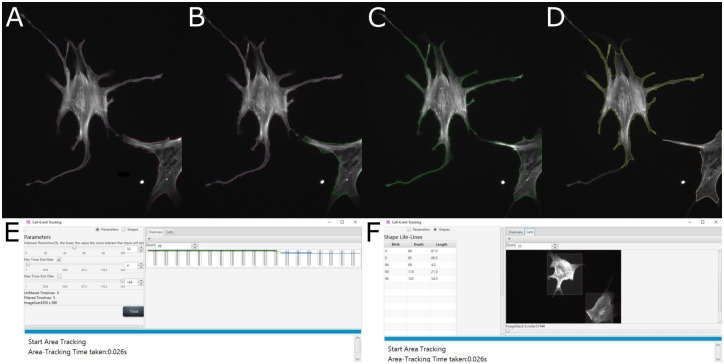
Fig 5. Bounding box feature for cell event detection.
Example visualization of cell events as they appear in the GUI: A: Initial images, two cells recognized. B: Color of right cell changed due to edge touching. C: Cell contact detected based on area outline of both cells, cells appear in same color. Note that the shown area outline does not stretch to the cell extension that is responsible for the ‘contact’ flag, as the area output of the FS2.0 is more filtered than the stage used for the bounding box feature. D: Cells de-touched again, both cells are assigned new lifelines and new colors. E: Bounding box feature window with filter options and lifelines found visible. F: Bounding box feature window with marked cells and cell lifeline information visible.

