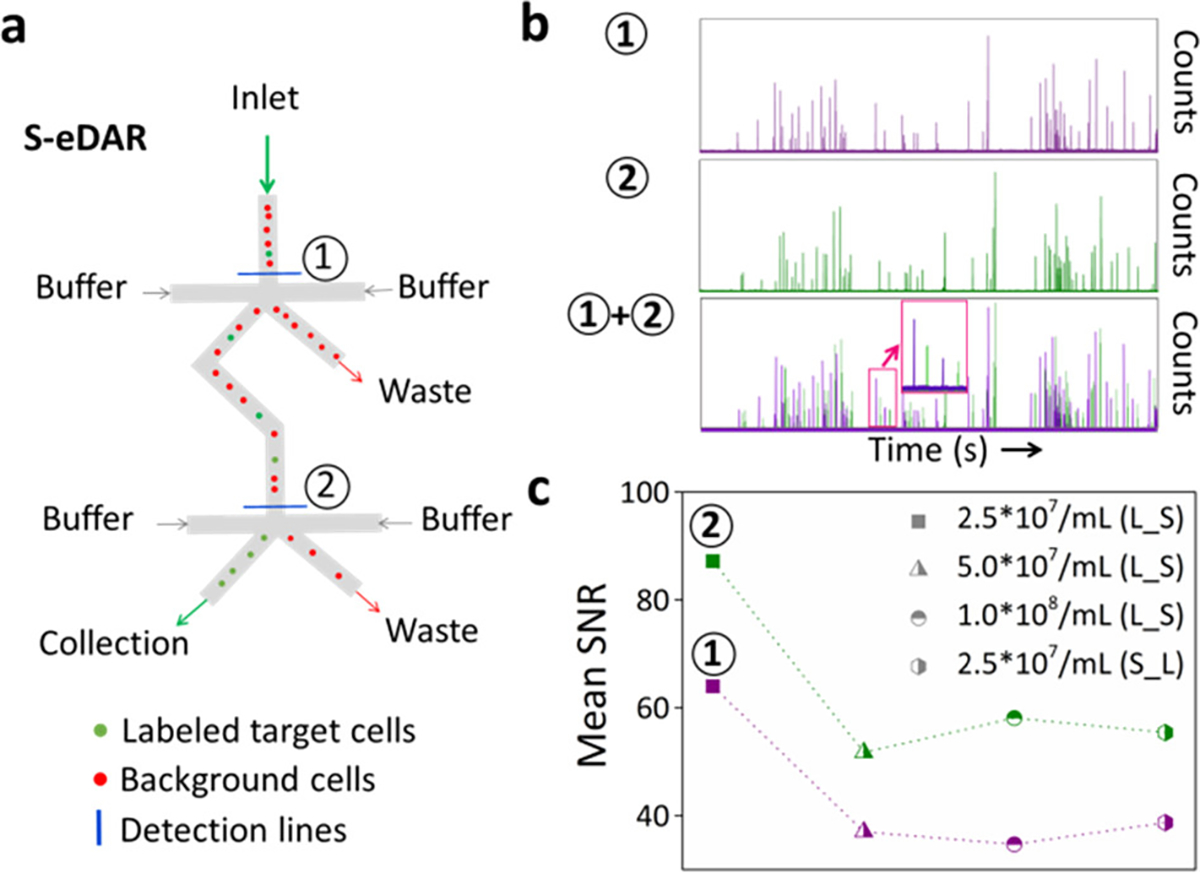
Figure 2.

S-eDAR recovery rate and SNR. (a) Schematic showing how S-eDAR works. Labeled target cells are sorted at the two detection lines before collection. (b) Labeled MCF-7 cells were spiked into a suspension of PBMCs at 2.5 × 10⁷ PBMCs/mL and then loaded onto an S-eDAR chip. APD traces at two detection lines and the overlay of two-channel traces were recorded. The inset in the overlay image shows that, after a signal from a labeled cell was recorded at the first detection line (purple), a signal from the same labeled cell is subsequently detected at the second detection line (green). (c) The mean SNR was calculated for traces from experiments with different PBMC densities (2.5 × 10⁷, 5.0 × 10⁷, and 1.0 × 10⁸ PBMCs/mL). Since these three experiments used labeled MCF-7 cells spiked into PBMCs, they are referred to as “L_S”. Experiments in which unlabeled MCF-7 cells were spiked into PBMCs at 2.5 × 10⁷ PBMCs/mL and then labeled are referred to as “S_L”.
