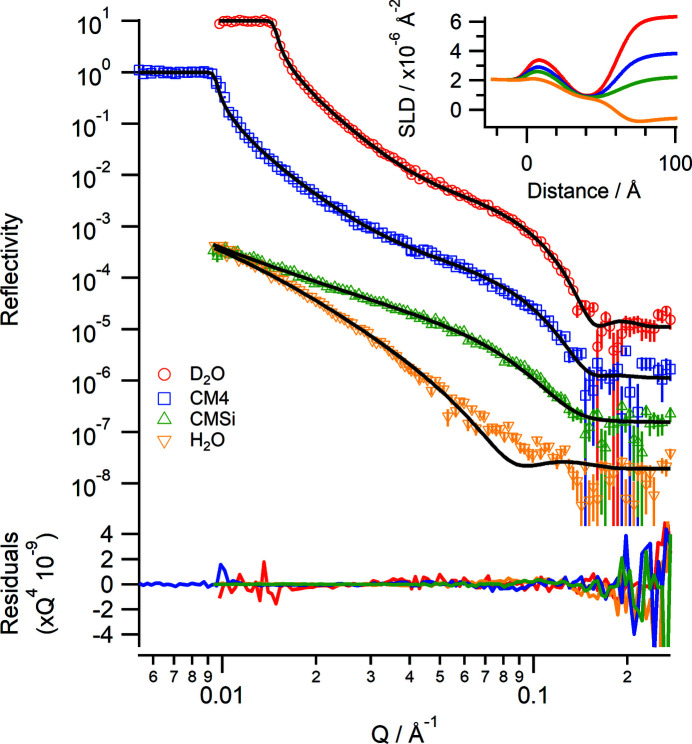
Figure 10.
Neutron reflectivity profiles of a DMPC bilayer at 310 K deposited onto a silicon wafer by vesicle rupture under different isotopic solvent contrasts. Red D2O, blue CM4, green CMSi, yellow H2O and black lines: fitted data. Data are offset for clarity. The lower panel shows the residuals between the data and fits normalized to Q 4. (Inset) The corresponding real-space SLD profile.

