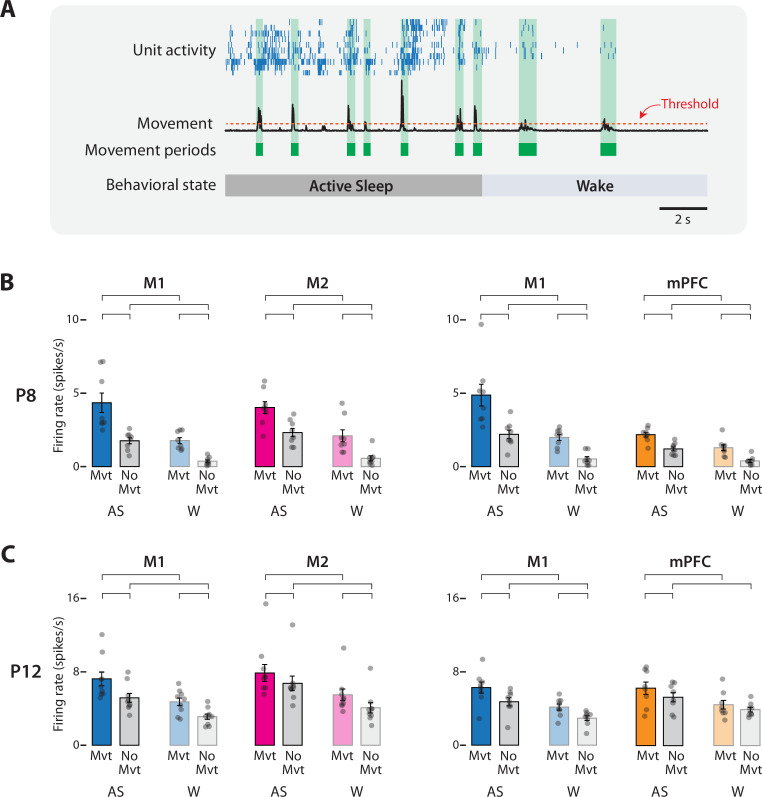
Figure 4. Movement-dependent unit activity in M1, M2, and mPFC in P8 and P12 rats.
(A) Representative 20-s segment of data showing unit activity (blue ticks), movement data (black trace), movement periods (green blocks), movement-detection threshold (horizontal dotted line), and behavioral state. (B) Bar graphs showing mean firing rates for neurons in M1, M2, and mPFC during periods of movement (Mvt) or no movement (No Mvt) across active sleep (AS) and wake (W). Mean firing rates for individual pups are shown as gray circles. Means ± standard error of the mean (SEM). Brackets denote significant difference between groups, p ≤ 0.0125. (C) Same as in B, but for P12.

