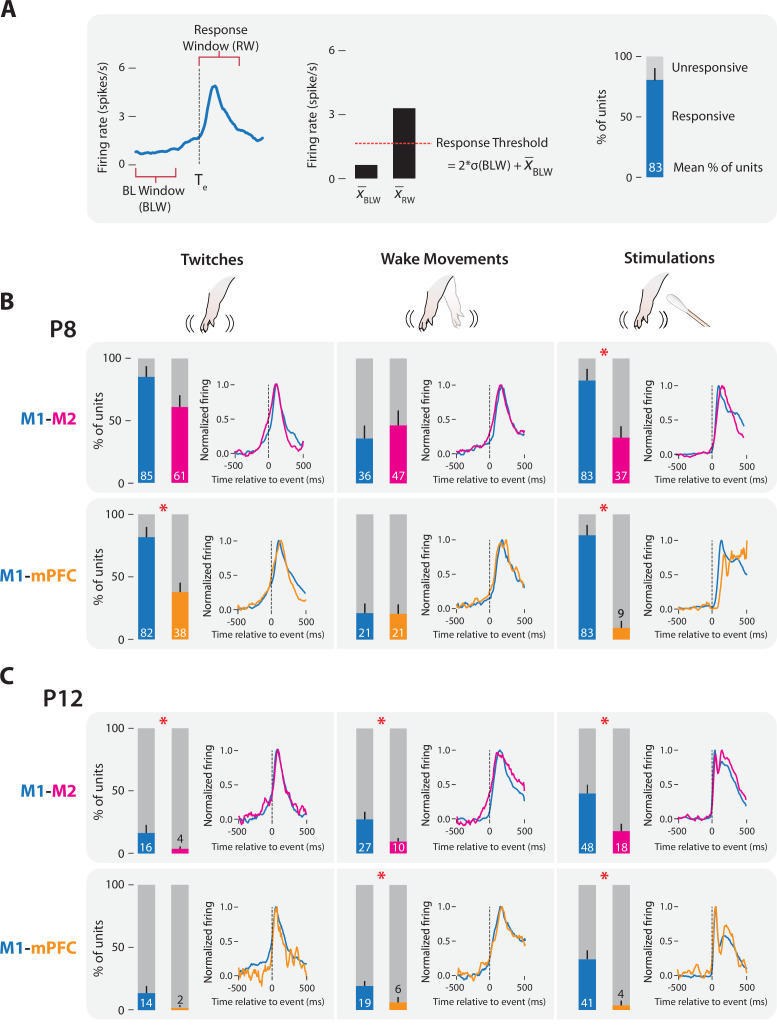
Figure 5. M1, M2, and mPFC neural responses to sensory input in P8 and P12 rats.
(A) Methodology for determining sensory responsiveness of individual units. Left: Perievent time histogram (PETH) of unit firing rate (blue line) relative to a sensory event, showing the baseline window (BLW) and response window (RW). Event onset denoted by dotted line at Te. Middle: Bar graph showing mean unit activity during the BLW and RW, response threshold (dotted line), and the threshold calculation. Right: Stacked plot showing the percentage of units that exceeded the response threshold (blue) and percentage of units that did not (gray). (B) Stacked plots showing mean percentage of responsive (colored) and unresponsive (gray) units across pups at P8. Top: Data from M1 (blue) and M2 (magenta) recordings. Bottom: Data from M1 (blue) and mPFC (gold) recordings. Means + standard error of the mean (SEM). Asterisks denote significant difference between cortical areas, p ≤ 0.017. PETHs to the right of each stacked plot show normalized unit firing rates for responsive units only in each cortical area. (C) Same as in B, but at P12.

