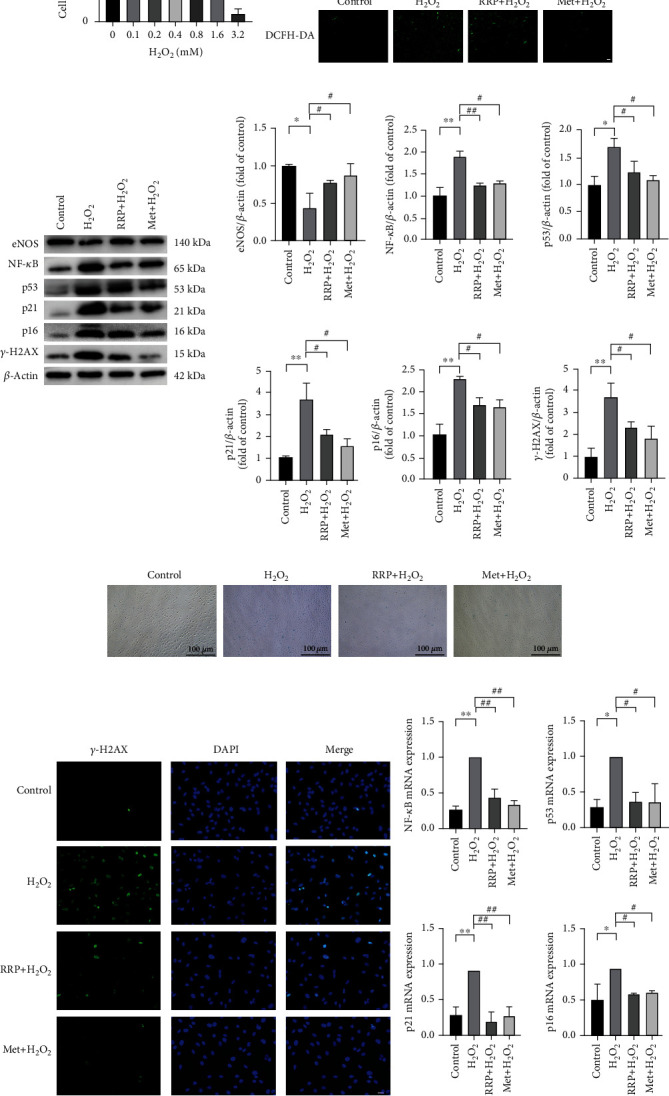
Figure 3.

RRP attenuates H2O2-induced senescence in HAECs. (a) Different concentration gradients of H2O2 intervention in HAECs with cell viability were detected by the CCK-8 method. (b) DCFH-DA was used to detect the levels of ROS in each group of HAECs. Scale bar = 100 μm. (c) Detection of senescence marker levels in the total protein of each group of HAECS by western blot. Data are shown as mean values ± SD per group and expressed as fold-over the control mean. (d) Representative staining images of SA-β-gal-positive cells after 2 h of early intervention with RRP or Met and 8 h of H2O2 intervention. (e) Immunofluorescence assay to detect γ-H2AX fluorescence levels in HAECs. Scale bar = 50 μm. (f) Quantitative amounts of mRNA senescence markers in each group of HAECS were detected by qRT-PCR. Data are shown as mean ± SD per group and expressed as fold-over the H2O2 mean (∗p < 0.05 and ∗∗p < 0.001 vs. control; #p < 0.05 and ##p < 0.001 vs. H2O2 by one-way ANOVA test).
