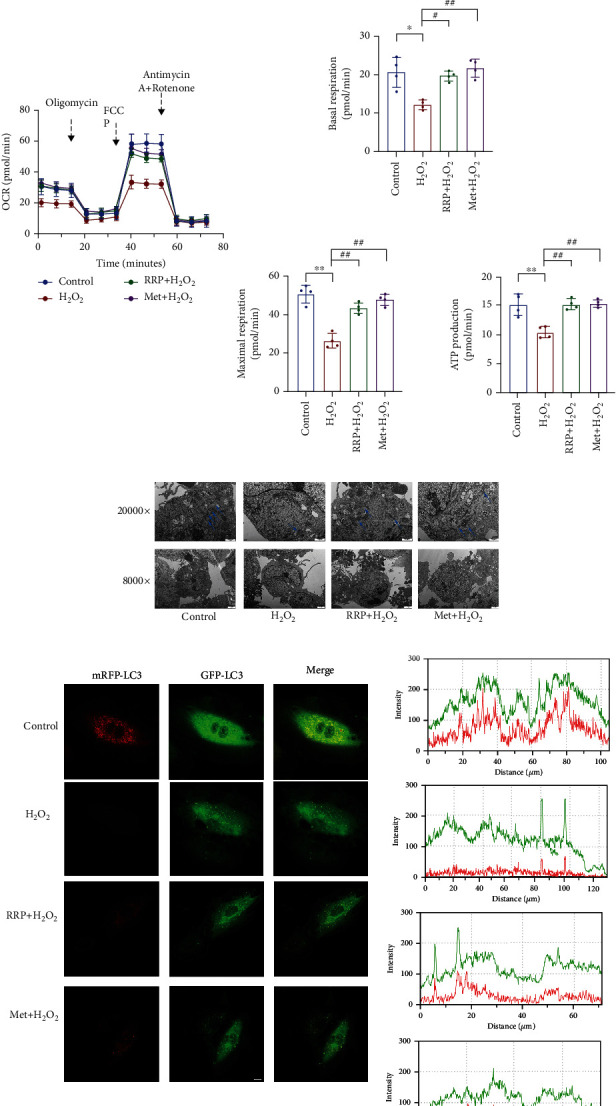
Figure 4.

RRP protects the autophagic function of HAECs. (a) MitoSOX Red staining to detect mtROS levels in each group. Bar = 50 μm. (b) Fluorescence microscopic observation of JC-1 probe to detect mitochondrial membrane potential. Scale bar = 100 μm. Data are shown as mean values ± SD. (c) Representative OCR profile and maximal respiration, basal respiration, and ATP rate from three independent experiments. The metabolic inhibitors oligomycin (1.5 mM), FCCP (2 mM), and rotenone/antimycin A (0.5 mM) were injected into differently treated cells at the indicated time points. Data are shown as mean values ± SD. (d) Transmission electron microscopy to detect the change of autophagic vesicles in each group of HAECs. (e) Adenovirus mRFP-GFP LC3B transduction of HAECs, laser confocal microscopy to observe LC3B levels. Scale bar = 10 μm. (f) Autophagy-associated protein levels in each group of HAECS as measured by western blot. Data are shown as mean values ± SD per group and expressed as fold-over the control mean (∗p < 0.05 and ∗∗p < 0.001 vs. control; #p < 0.05 and ##p < 0.001 vs. H2O2 by one-way ANOVA test).
