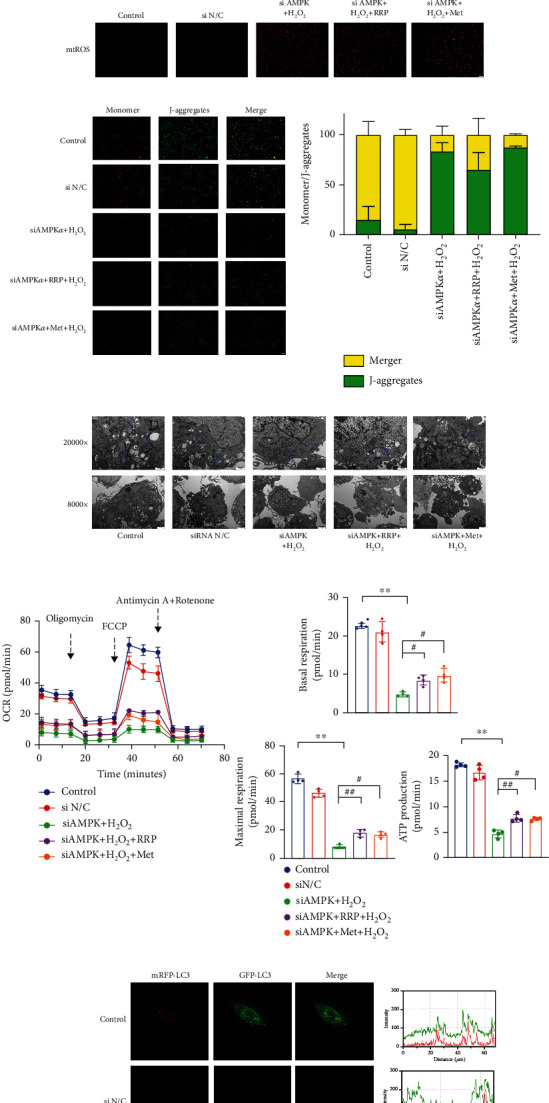
Figure 6.

siAMPKα inhibited the protective effect of RRP on the autophagic function of HAECs. (a) siAMPKα intervention in HAECs for 8 h and AMPKα amounts in mRNA of HAECs after 2 d. (b) DCFH-DA detection of ROS levels in each group of HAECs after siAMPKα treatment. Scale bar = 100 μm. (c) Levels of AMPKα, p-AMPKα, mTOR, p-mTOR, eNOS, p62, beclin-1, and LC3B in siAMPKα, H2O2, RRP, Met-treated, or untreated HAECs were detected by western blot. Data are shown as mean values ± SD per group and expressed as fold-over the control mean. (d) Detection of mtROS levels in each group by MitoSOX Red staining after siAMPKα treatment. Scale bar = 50 μm. (e) Detection of mitochondrial membrane potential by JC-1 probe after siAMPKα treatment in HAECs. Scale bar = 100 μm. Data are shown as mean values ± SD. (f) Transmission electron microscopy to detect the change of autophagic vesicles in each group of HAECs. (g) Levels of OCR profile and maximal respiration, basal respiration, and ATP rate in HAECs after siAMPKα treatment by transmission electron microscopy to observe the levels of autophagic vesicles in HAECs after siAMPKα treatment. Data are shown as mean values ± SD. (h) Laser confocal microscopy observation of adenovirus-transduced mRFP-GFP LC3B levels in HAECs after siAMPKα treatment. Scale bar = 10 μm. (i) Detection of AMPKα and mTOR levels in siAMPKα-treated HAECs by qRT-PCR. Data are shown as mean values ± SD per group and expressed as fold-over the H2O2 mean (∗p < 0.05 and ∗∗p < 0.001 vs. control; #p < 0.05 and ##p < 0.001 vs. siAMPKα+H2O2; ♢ = ns vs. siAMPKα+H2O2 by one-way ANOVA test).
