Figure 1.
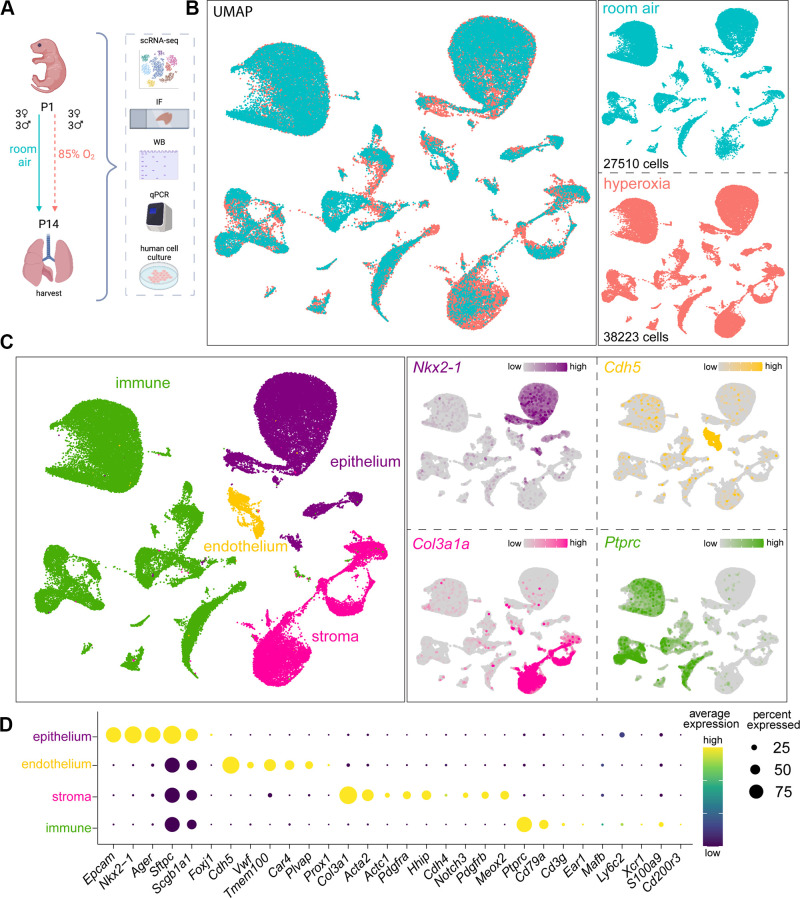
Lung cellular architecture in room air and hyperoxia at P14 by scRNA-seq. A: illustration generated with permission on BioRender of experimental design: mouse pups were exposed to 85% oxygen or RA from P1 to P14, and the lungs were used for single cell RNA-seq (scRNA-seq), immunofluorescence (IF), whole lung lysate qRT-PCR, and western blotting. Human primary cells were used for validation of mouse scRNA-seq data. B: left: scRNA-seq UMAP with merged treatment conditions, RA (blue), and hyperoxia (pink), showing overlapping clusters. Right: UMAPs of cells in each condition show similarities and differences, with cell numbers specified in each case. Three females and 3 males were sequenced per group. C: seurat unbiased clustering grouped all cells into 37 clusters which we attributed to four cell lineages shown in UMAP (left). Epithelial, endothelial, stromal, and immune cell identities were determined by the expression of Nkx2-1, Chd5, Col3a1, and Ptprc, respectively, shown in feature plots (right). D: dot plot depicting expression level (dot color) and percentage of expression (dot size) of markers used to identify subpopulations within each major cell lineage. RA, room air.

