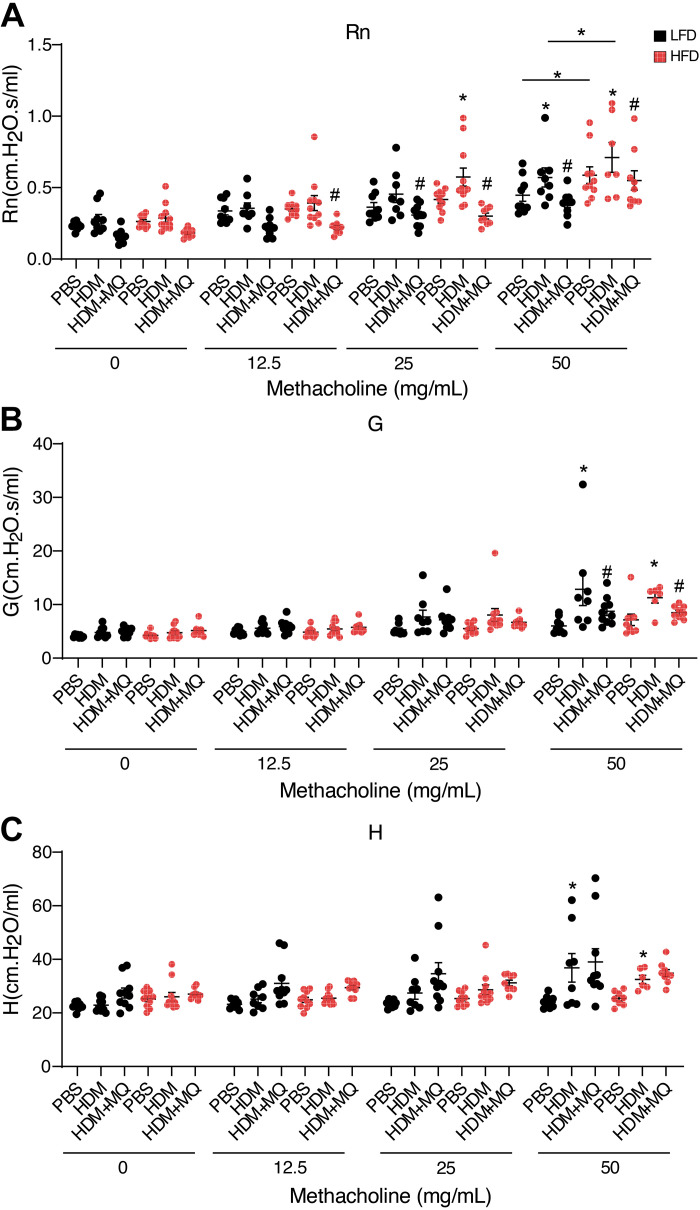
Figure 5.
Analysis of methacholine-induced AHR in mice. A: central airway resistance (Rn) in response to methacholine. B: tissue resistance or damping G response to methacholine. C: tissue elastance H response to methacholine. P values < 0.05 were regarded as discovery or statistically significant. Error bars ± SE. *Significant differences between PBS and HDM groups. #Significant differences between HDM and HDM + MQ groups. AHR, airway hyperresponsiveness; HDM, house dust mite.

