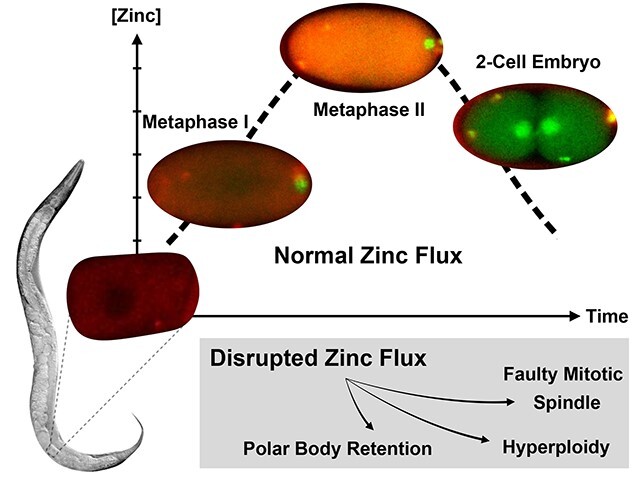
Figure 1.

Transient changes in both labile and total zinc in Caenorhabditis elegans oocytes and embryos across meiotic and early mitotic stages. (A) The distribution of labile zinc using ZincBY-1 fluorescence as a reporter (left column, red in the merge). Developmental stages were assigned using a worm strain expressing GFP::tubulin and GFP::H2B histone (middle column, green in the merge). Labile zinc is apparent throughout the cytoplasm in MI (n = 2) and increased significantly as cells enter MII (n = 5). Finally, labile zinc in the 2-cell embryo (n = 5) is not apparent in the cytoplasm but is apparent in the eggshell in seven experiments. Scale bar =10 μm. (B, C) Total zinc, copper, and iron content at the single cell level was established using XFM across four experiments and is shown in units of atoms/cell. Example images are shown in B and quantification is shown in C; the number of cells analyzed for each stage was greater than 7. Most of the stages were analyzed in wild-type (N2) worms (Prophase I, n = 15; Embryo, n = 7; 1-cell, n = 10; 2-cell, n = 10), except for the Metaphase I-arrest stage (n = 15), which was assessed in worms with a temperature-sensitive mutation in the anaphase-promoting complex component emb-27. In wild-type, the “embryo” stage refers to fertilized embryos undergoing the meiotic divisions, whereas the “1-Cell” and “2-Cell” stages are in mitosis. Total Zn content increased by more than threefold between Metaphase I and the embryo stage. Fe and Zn generally display a similar flux pattern across the meiotic and mitotic stages. Scale bar = 10 μm (1-cell) and 20 μm (PI, MI, and 2-cell). The color legend indicates the spectrum of intensity of total zinc with blue being low intensity, and low levels of total zinc, and red being high intensity and high levels of total zinc. (C) The letters above the bars represent statistical significance between developmental stages for the given element where P < 0.05. Letters that are the same are statistically insignificant (P > 0.05). Statistical analysis was conducted by performing a one-way ANOVA followed by a Student t-test.
